Bitcoin’s latest price action is sending shockwaves through the crypto market. After a brutal 17% drop, Bitcoin now trades at $106,983.00, having touched a low of $104,717.00 in the last 24 hours. This isn’t just a routine dip - it’s the aftermath of the largest single-day liquidation in crypto derivatives history, with over $19 billion wiped out. The question on every trader’s mind: is this a golden buying opportunity, or the start of a deeper collapse?
Bitcoin Plunges Below $104,000: What Triggered the Crash?
The October 2025 crypto crash wasn’t just about market jitters. The catalyst? Escalating geopolitical tensions. President Donald Trump’s announcement of a 100% tariff on Chinese imports, coupled with threats of export controls, sparked a global risk-off event. As equities and commodities sold off, Bitcoin was swept into the panic, falling over 14% to a session low of $104,783. Liquidations surged, leverage got obliterated, and the Bitcoin Fear and amp; Greed Index plunged into ‘Extreme Fear’ territory.
For those who’ve watched Bitcoin for years, this isn’t entirely new. But the scale is unprecedented. As one analyst put it, "Leverage destroys dreams, especially in a market this big and liquid. " The speed and depth of this drop left even seasoned traders stunned.
Is Now a Good Time to Buy Bitcoin?
With Bitcoin at $106,983.00, opinions are split. Arthur Hayes, former BitMEX CEO, is pounding the table to buy, arguing that extreme fear often marks the best entry points. On the other side, Andrew Tate is warning of a deeper crash, pointing to the record liquidations and persistent macro risks. Meanwhile, Polymarket data shows a 52% probability that Bitcoin could fall below $100,000 this month, reflecting a market on edge.
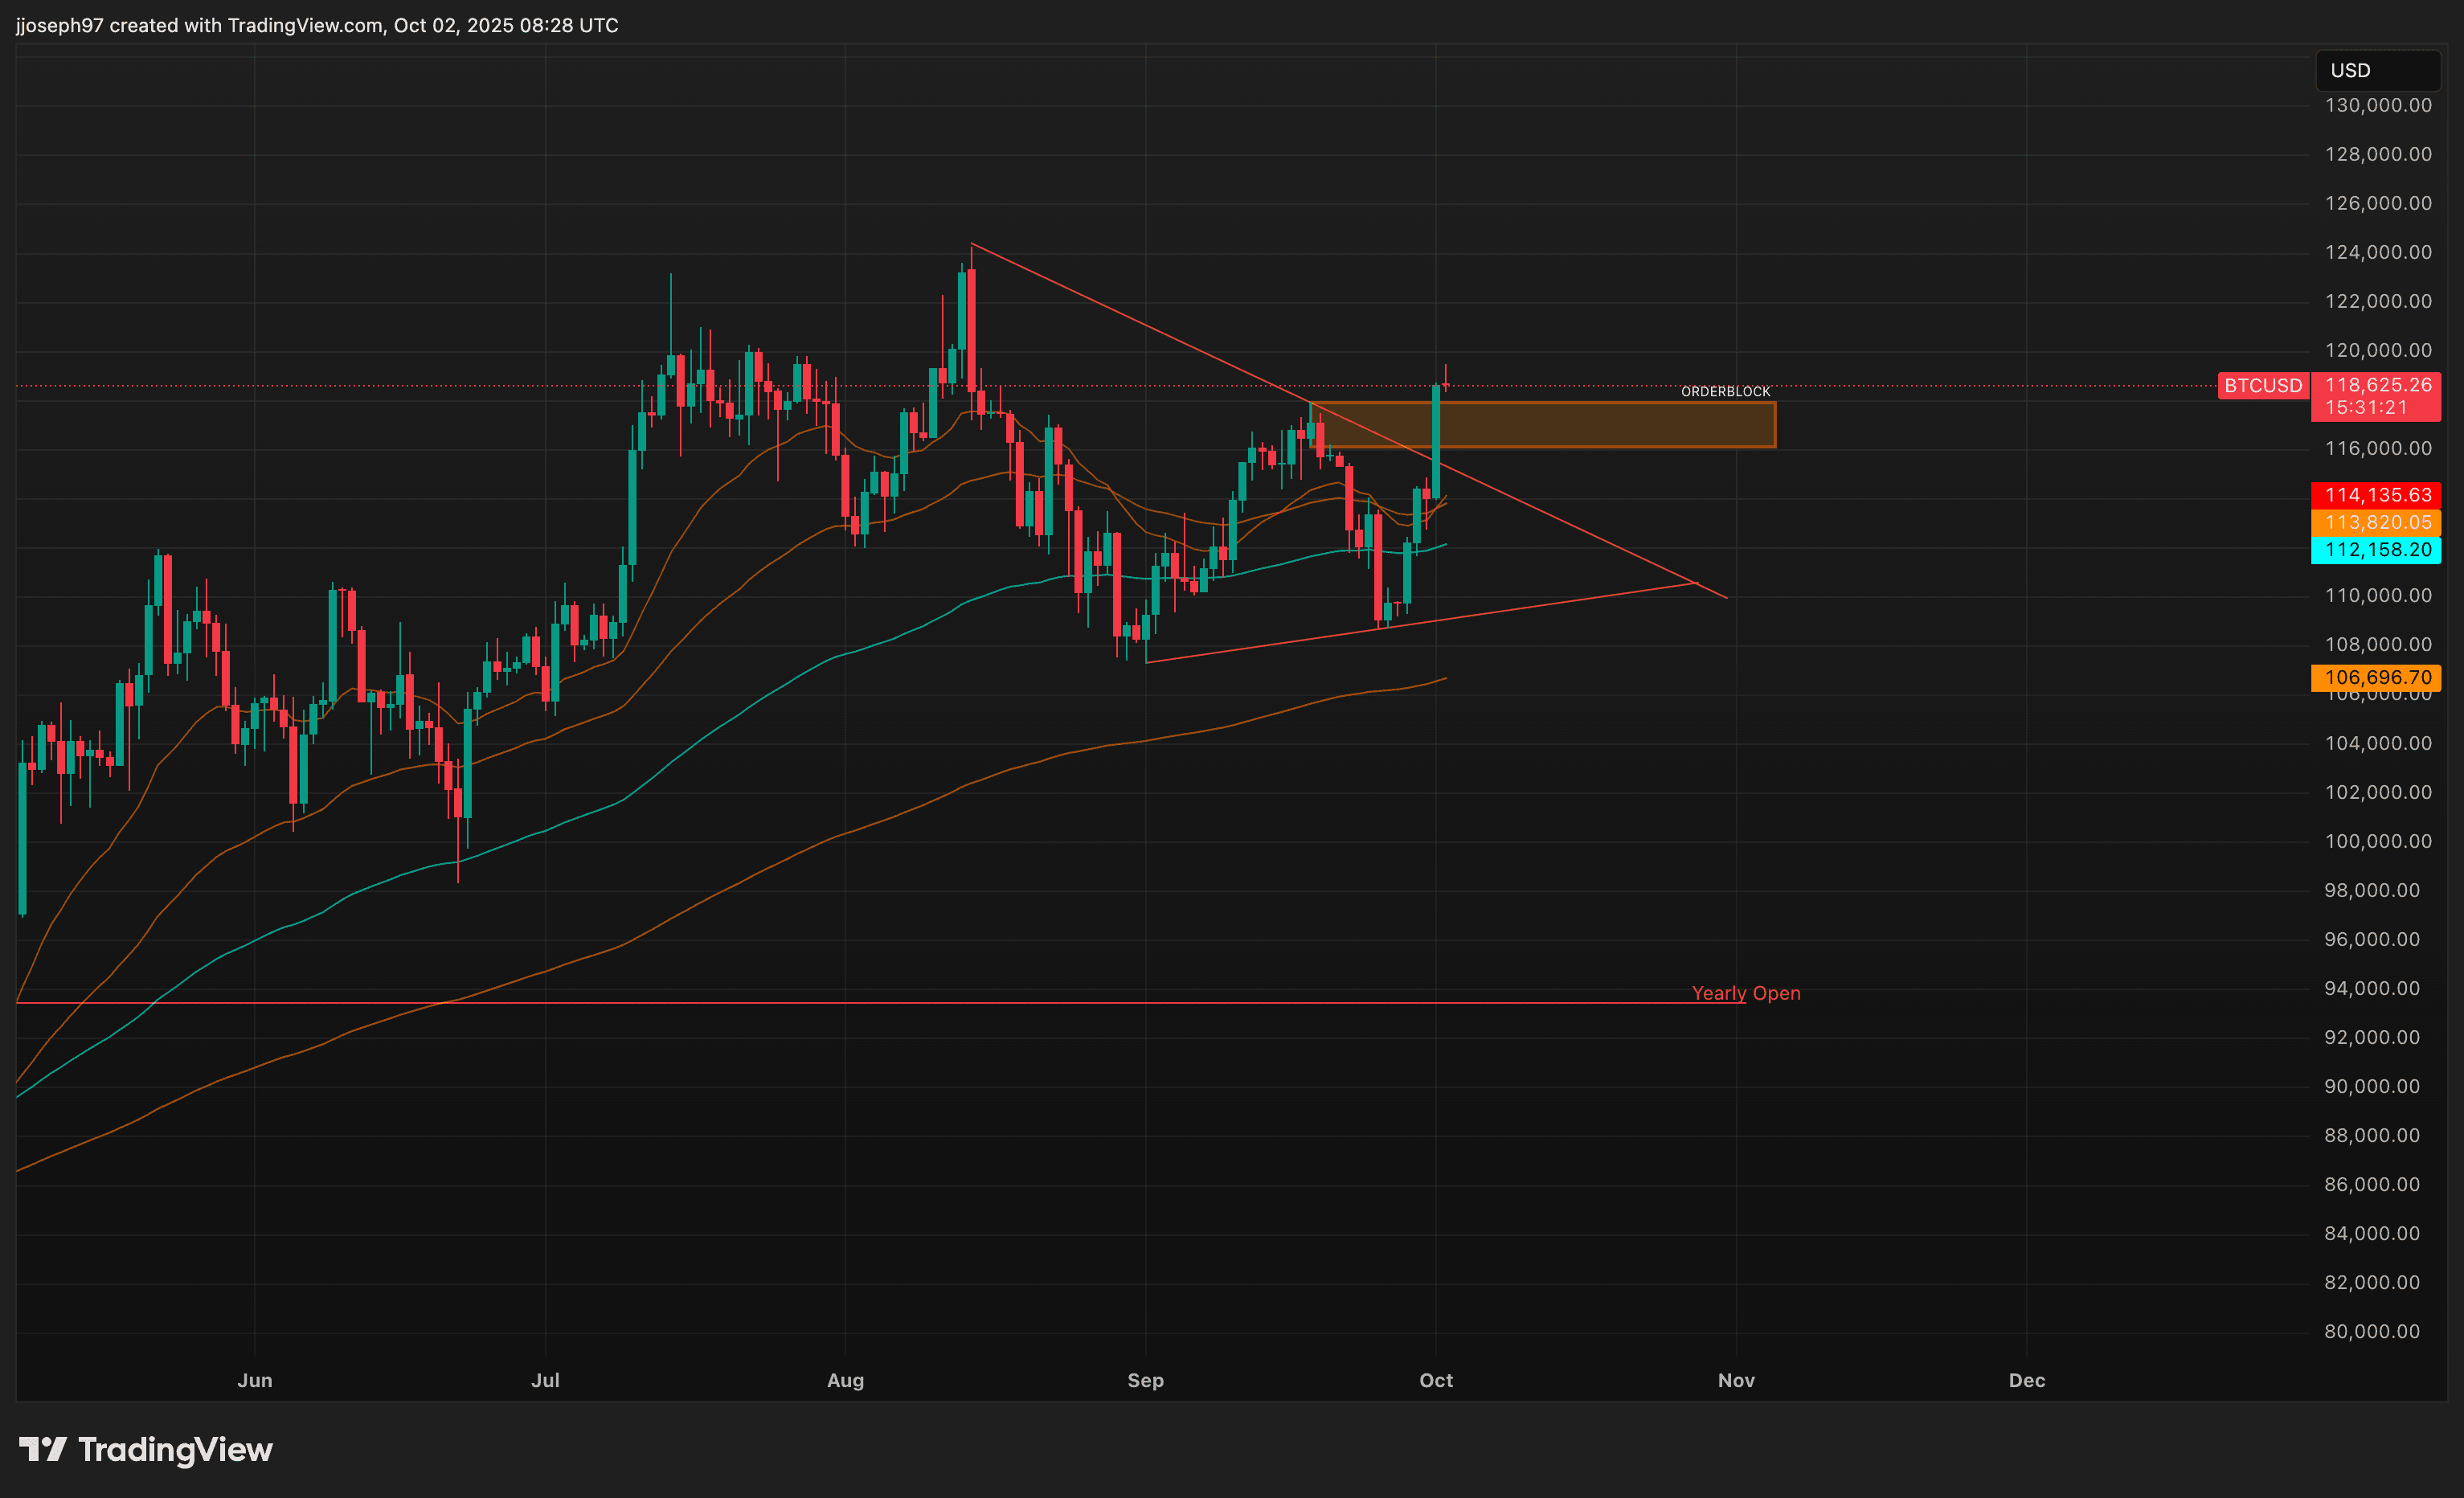
The technicals are just as conflicted. Glassnode analysts say a clean break below $104,000 could open the door to $93,000–$95,000. But if bulls reclaim the $114,000–$116,000 range, momentum could flip fast. This is classic crypto market volatility: huge risk, huge potential reward.
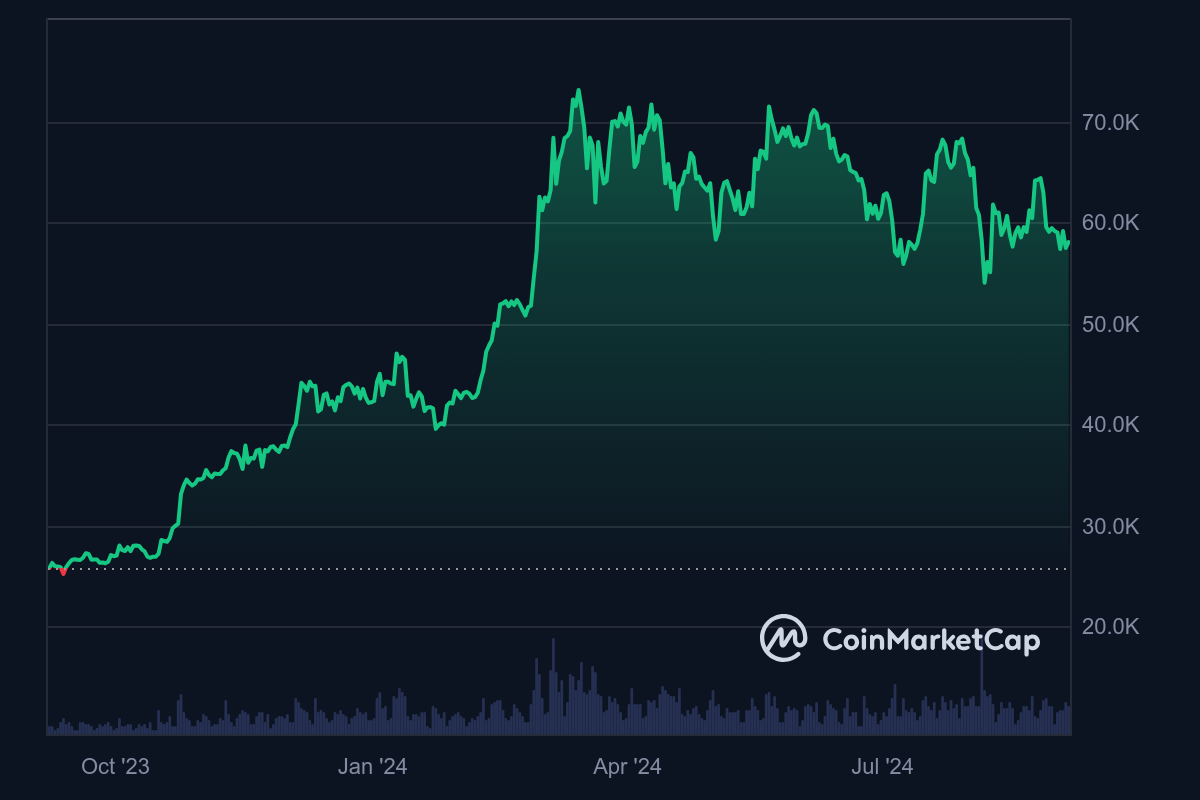
Bitcoin Technical Analysis Chart
Analysis by Troy Bennett | Symbol: BINANCE:BTCUSDT | Interval: 4h | Drawings: 6
Technical Analysis Summary
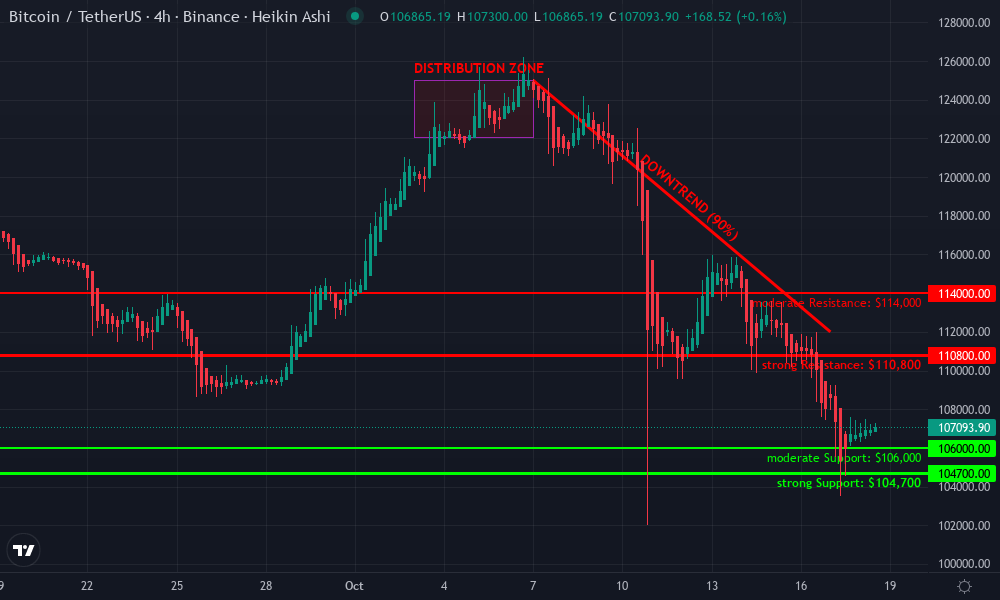
Draw a major downtrend line from the October high near $125,000 to the latest lower highs around $112,000. Mark horizontal support at $104,700 (recent low) and $106,000 (current consolidation). Place resistance lines at $110,800 (recent breakdown area) and $114,000 (major pivot). Highlight the brief consolidation zone after the crash between $106,000 and $107,500. Use arrow markers to show failed bounce attempts and breakout/breakdown zones. Annotate with callouts for the crash event and the current 'extreme fear' sentiment. Use a rectangle to capture the sideways action post-crash, and text to label high-risk accumulation zone.
Risk Assessment: high
Analysis: Market just experienced an extreme event and is consolidating near lows with sentiment at 'extreme fear.' Knife-catching is high risk but can be high reward if managed tightly. Downtrend still intact unless $110,800 is reclaimed.
Troy Bennett's Recommendation: Aggressive traders can scale-in at $106,000 with tight stops below $104,000, targeting a quick reversal to $110,800 and potentially $114,000. Stay nimble and don't fight the tape if $104,700 breaks.
Key Support & Resistance Levels
📈 Support Levels:
- $104,700 - Recent crash low; key line in the sand for bulls strong
- $106,000 - Short-term consolidation support zone moderate
📉 Resistance Levels:
- $110,800 - Breakdown zone; first major resistance for any bounce strong
- $114,000 - Pivot area; reclaim here could ignite a squeeze moderate
Trading Zones (high risk tolerance)
🎯 Entry Zones:
- $106,000 - Aggressive entry in high-risk accumulation zone as price stabilizes post-crash high risk
- $110,800 - Momentum entry on reclaim of breakdown level medium risk
🚪 Exit Zones:
- $104,000 - Invalidation/stop-loss if support fails 🛡️ stop loss
- $114,000 - Profit target if bulls reclaim momentum 💰 profit target
Technical Indicators Analysis
📊 Volume Analysis:
Pattern: Expected spike during crash; watch for volume drop-off as price consolidates
Crash likely flushed out leverage, high volume on flush, now drying up.
📈 MACD Analysis:
Signal: Likely bottoming but still bearish. Wait for bullish cross confirmation.
MACD likely deeply oversold, but no bullish cross yet.
Applied TradingView Drawing Utilities
This chart analysis utilizes the following professional drawing tools:
Disclaimer: This technical analysis by Troy Bennett is for educational purposes only and should not be considered as financial advice. Trading involves risk, and you should always do your own research before making investment decisions. Past performance does not guarantee future results. The analysis reflects the author's personal methodology and risk tolerance (high).
Market Sentiment: Extreme Fear or Strategic Opportunity?
Sentiment is at rock bottom. The Fear and amp; Greed Index hasn’t been this low in months. Historically, these moments have been prime buying opportunities for long-term investors with conviction. But let’s be clear: this isn’t a time for blind optimism. The macro backdrop is ugly and volatility is off the charts.
Here’s what I’m watching:
- Volume and Liquidations: Are we seeing capitulation or just the start of a new downtrend?
- On-chain Flows: Are whales accumulating or dumping?
- Macro Signals: Will risk assets stabilize if geopolitical tensions cool?
Bitcoin Price Prediction 2026-2031 (Post-2025 Crash Analysis)
Forecasts reflect current market volatility, potential recovery scenarios, and ongoing macroeconomic/regulatory risks.
| Year | Minimum Price | Average Price | Maximum Price | YoY % Change (Avg) | Market Scenario Insights |
|---|---|---|---|---|---|
| 2026 | $88,000 | $112,000 | $138,000 | +5% | Volatility remains high; recovery possible if macro risks subside. Bear case: prolonged risk-off sentiment. |
| 2027 | $95,000 | $122,000 | $155,000 | +9% | Gradual uptrend as leverage stabilizes, institutions return. Bear case: regulatory clampdown delays rebound. |
| 2028 | $110,000 | $139,000 | $178,000 | +14% | Halving effect fuels renewed interest. Bull case: global adoption accelerates; bear case: tech stagnation. |
| 2029 | $128,000 | $165,000 | $210,000 | +19% | Post-halving cycle peak; strong network effects. Bear case: new competition or adverse regulation. |
| 2030 | $147,000 | $183,000 | $238,000 | +11% | Broader crypto market maturity, ETF/retail inflows. Bear case: economic recession slows growth. |
| 2031 | $162,000 | $205,000 | $265,000 | +12% | Potential for new all-time highs if adoption continues. Bear case: plateau if innovation stalls. |
Price Prediction Summary
Bitcoin's current post-crash price action suggests a period of heightened volatility and uncertainty through 2026, with the potential for a gradual recovery as market confidence returns. While macroeconomic and regulatory risks persist, historical patterns indicate that extreme bearish sentiment can set the stage for medium- to long-term rebounds, especially after major deleveraging events. Bullish scenarios see Bitcoin reaching new highs by 2029–2031, fueled by adoption, technological advances, and network effects. Bearish outcomes remain possible if regulation tightens or macro headwinds persist.
Key Factors Affecting Bitcoin Price
- Macroeconomic instability (e.g., geopolitical tensions, global recessions)
- Regulatory changes and enforcement (e.g., US, China, EU)
- Institutional adoption and inflows (e.g., ETFs, pension funds)
- Technological developments (e.g., scaling, privacy, integration with TradFi)
- Market sentiment cycles (Fear & Greed Index, post-crash psychology)
- Competition from alternative cryptocurrencies or stablecoins
- Impact of Bitcoin halvings and supply dynamics
- Potential for black swan events (exchange failures, security breaches)
Disclaimer: Cryptocurrency price predictions are speculative and based on current market analysis. Actual prices may vary significantly due to market volatility, regulatory changes, and other factors. Always do your own research before making investment decisions.
If you’re considering buying this dip, position sizing and risk management are non-negotiable. There’s no shame in waiting for confirmation - but historically, fortune has favored the brave when fear is at its peak.
One key lesson from the October 2025 crash: leverage is a double-edged sword. Excessive risk-taking fueled historic liquidations, amplifying the downside. If you’re stepping into this market, keep your leverage low and your stops tight. The best traders aren’t the ones who catch the exact bottom, but those who survive the volatility and live to trade another day.
Secure Bitcoin Buying Tips in a Volatile Market
For those determined to buy, execution matters more than ever. Here’s how to approach Bitcoin at $106,983.00 with discipline:
Actionable Tips for Secure Bitcoin Buying Now
- Enable Two-Factor Authentication (2FA): Secure your accounts by activating 2FA using apps like Authy or Google Authenticator. This adds a critical layer of protection, especially during periods of high market volatility.

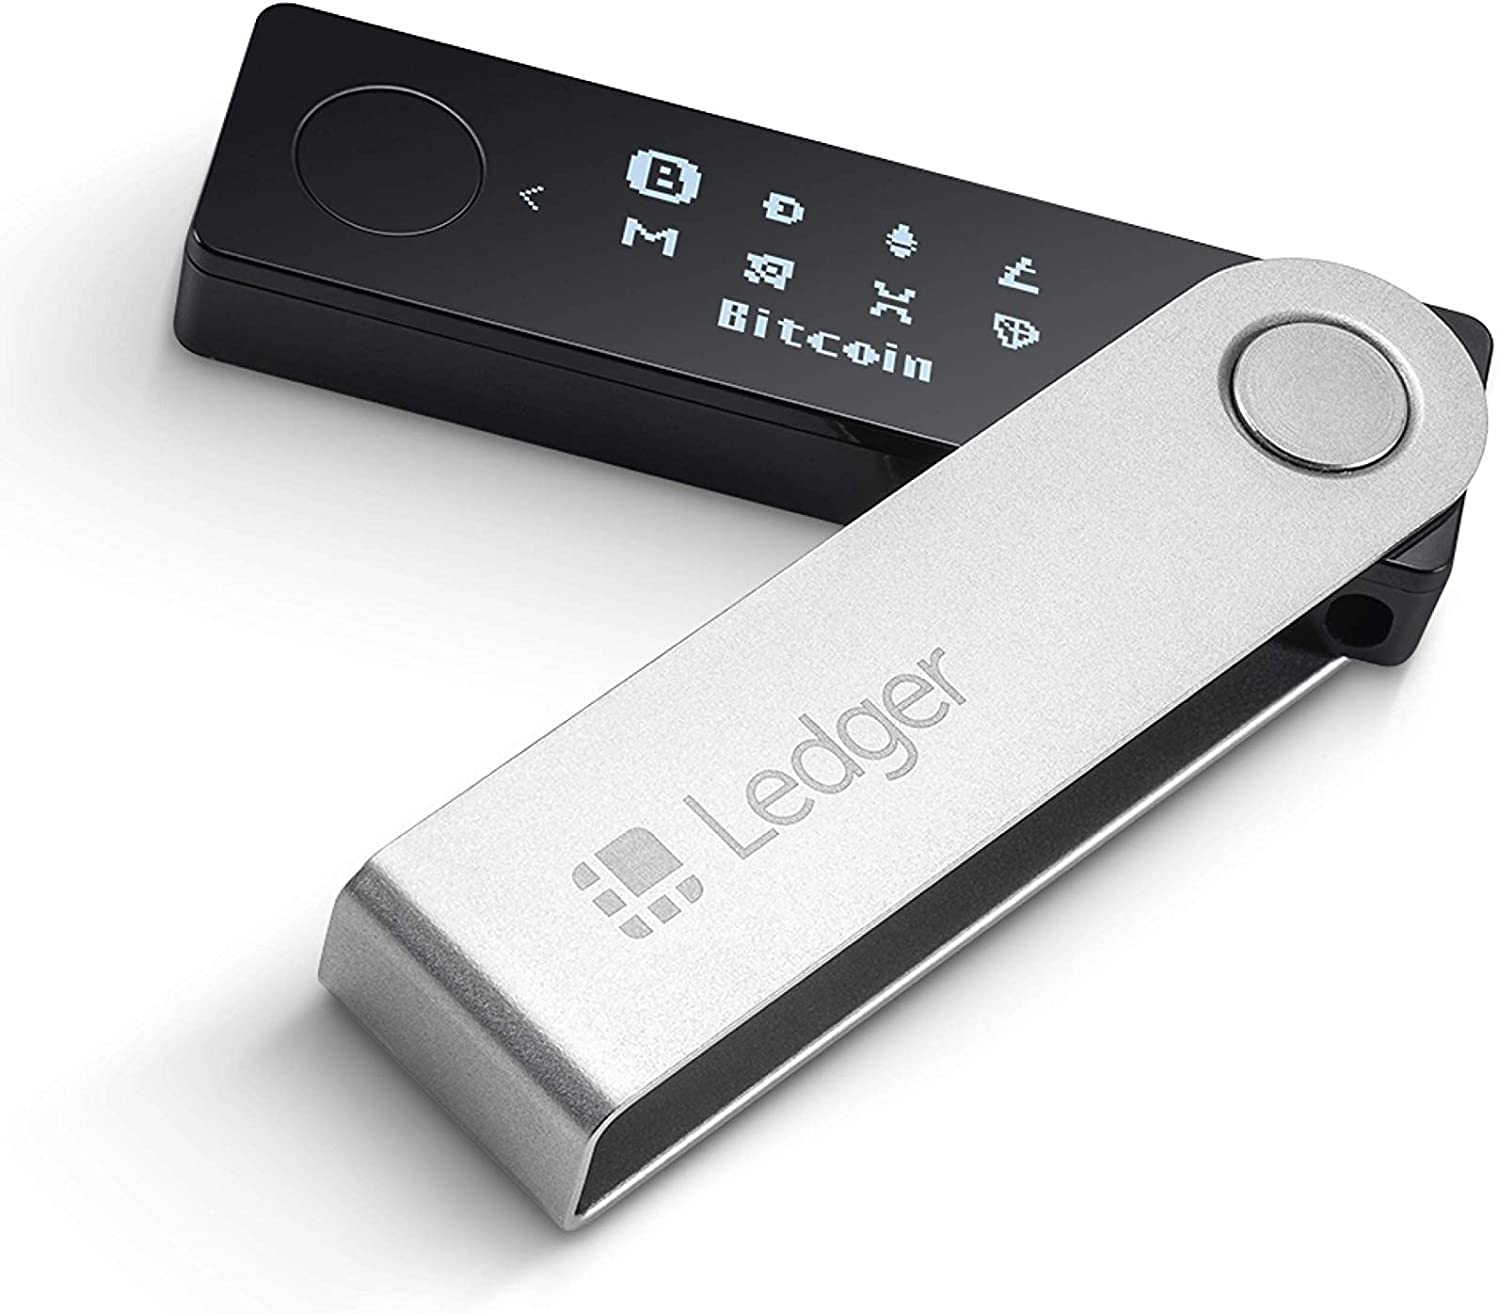
- Transfer Bitcoin to a Hardware Wallet: After purchase, move your Bitcoin to a hardware wallet like Trezor or Ledger Nano X. This keeps your assets safe from exchange hacks and online threats.
- Set Price Alerts with Trusted Apps: Monitor Bitcoin’s price swings by setting alerts on platforms like Blockfolio (now FTX App) or CoinGecko. This helps you act quickly if Bitcoin approaches key levels, such as the $104,000 support or $114,000 resistance.

- Start with Small, Incremental Purchases: Use dollar-cost averaging (DCA) via services like Coinbase or Swan Bitcoin to reduce risk and avoid making large, single purchases during extreme volatility.

Don’t ignore security. Use reputable exchanges with strong track records, enable two-factor authentication, and consider self-custody for significant holdings. In high-stress markets, hacks and phishing attempts spike as well, so double-check every transaction.
Bitcoin vs Gold: Which Hedge Wins in 2025?
With global uncertainty peaking, some investors are weighing Bitcoin versus gold as a safe haven. Gold has held steady while Bitcoin plunged. But crypto’s upside remains unmatched if the macro winds shift. For risk-tolerant investors, dollar-cost averaging into Bitcoin at current levels could pay off handsomely if sentiment reverses. Still, diversification is king. Don’t put your entire portfolio on the line for a single asset - especially in a market this wild.
What Comes Next? Key Levels and Scenarios to Watch
All eyes are on the $104,000 support. A decisive breakdown could trigger a cascade toward the $93,000–$95,000 region, as flagged by Glassnode. On the flip side, a swift recovery above $114,000–$116,000 could trap late shorts and spark a sharp rally. Until then, expect chop - and don’t get lulled into complacency by short-term bounces.
For those on the sidelines, patience is a position too. Wait for the dust to settle and let price action confirm the next trend. If you’re active, size your trades small and stay nimble. Extreme fear can create extreme opportunity - but only for those with a plan and the discipline to stick to it.
Is Bitcoin at $106,983 a buying opportunity or a warning sign?
Bitcoin's recent plunge below $104,000 and its current price of $106,983 have sparked debate among investors. With extreme fear in the market and ongoing geopolitical tensions, do you see this dip as a chance to buy or a reason to be cautious?
The crypto market is unforgiving, but it never stays down forever. If you’re looking for deeper analysis on why crypto is down today and what could drive the next move, check out this expert breakdown. Stay sharp, stay secure, and remember: in crypto, volatility is the price of admission for outsized returns.


No comments yet. Be the first to share your thoughts!