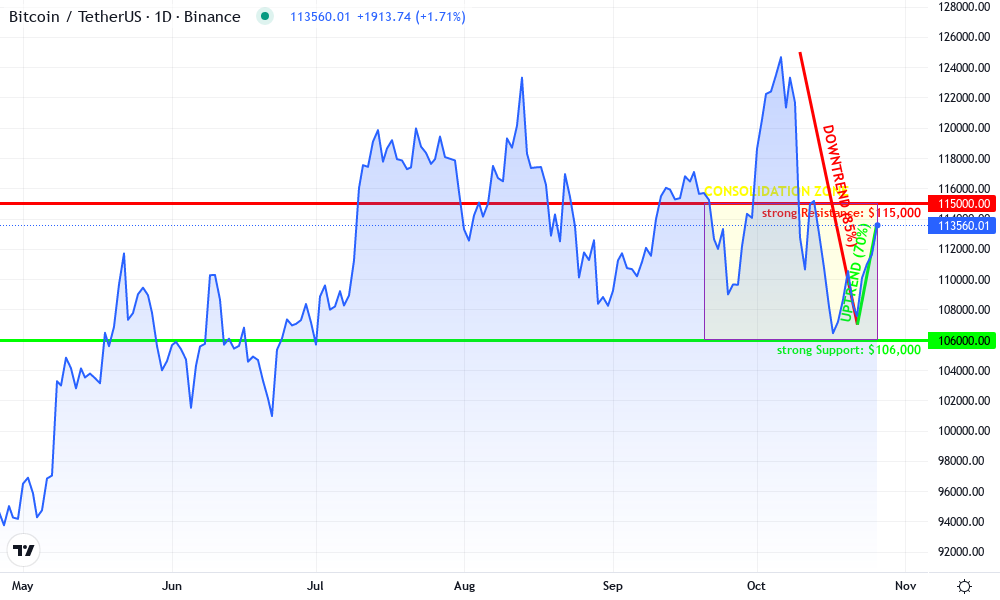
Bitcoin is once again at the center of attention as it navigates a period of intense market indecision. Currently priced at $113,599, Bitcoin has seen a modest 1.71% increase over the past 24 hours, but this movement belies the underlying tension evident in its recent trading pattern. The cryptocurrency has been trapped in a tight range, with volatility compressing and traders closely watching key liquidity zones for the next big move.
Why Bitcoin’s Tight Trading Range Matters Now
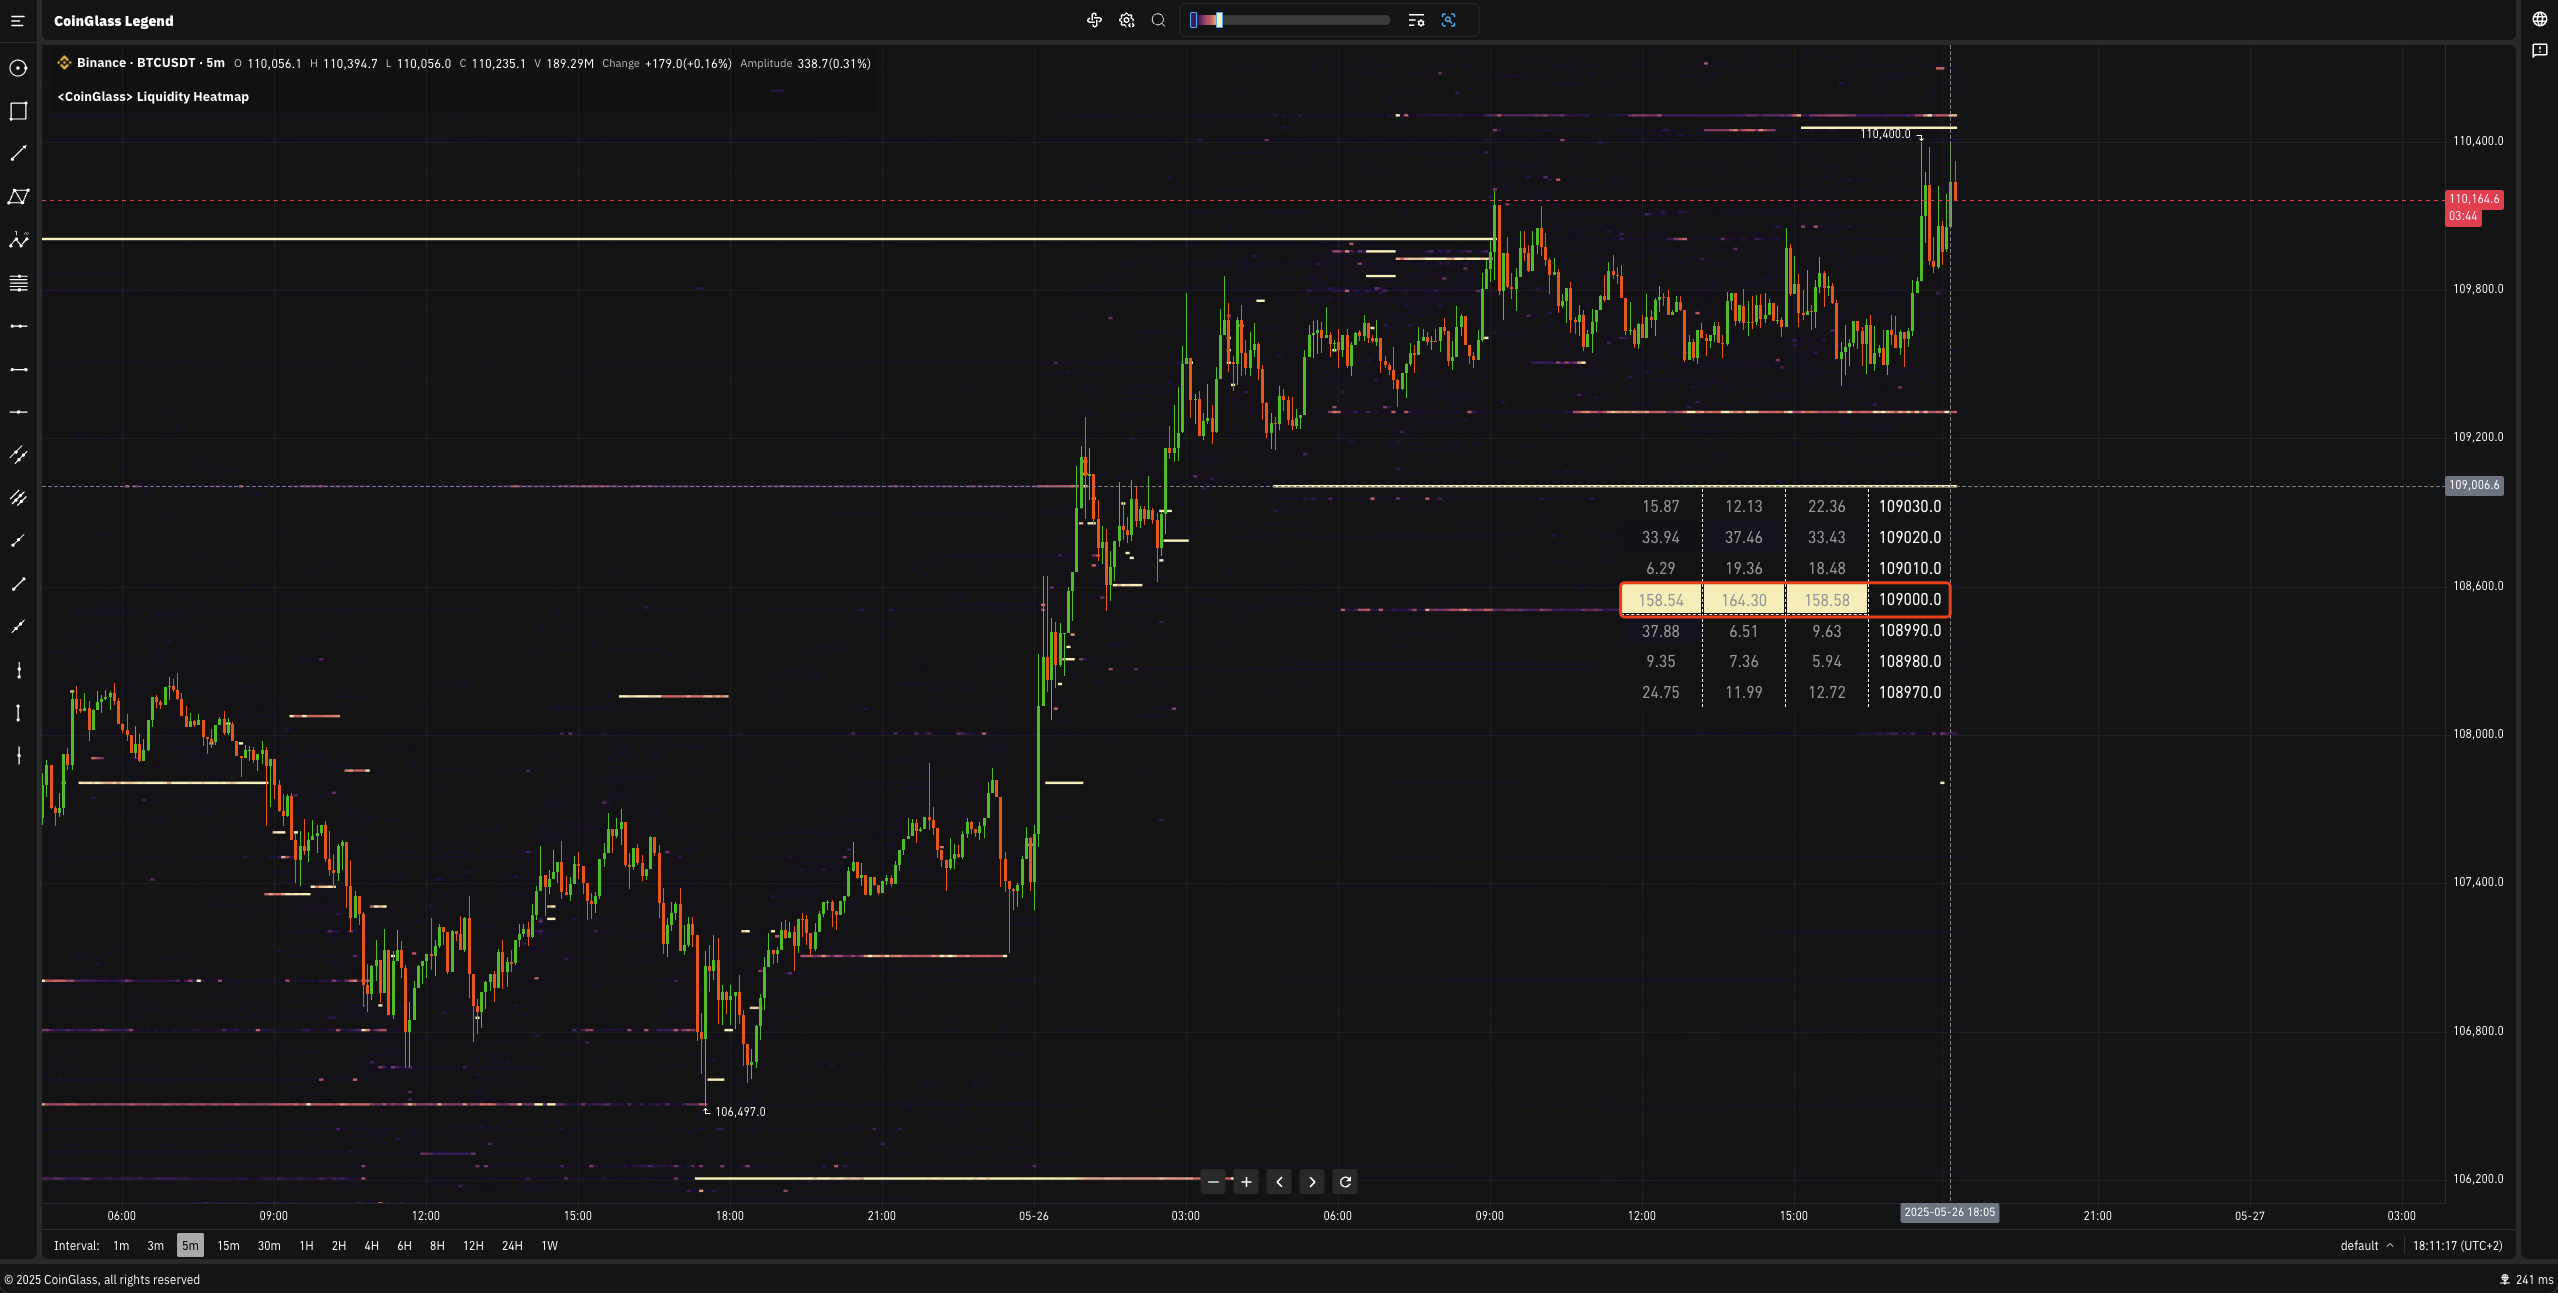
Periods of consolidation like this are not uncommon in Bitcoin’s history, but they often serve as precursors to significant price action. As highlighted by recent liquidity heatmap analyses, there are now pronounced liquidity clusters at $115,000 and $106,000. These levels act as magnets for price action, drawing in both buyers and sellers who are positioning themselves ahead of a potential breakout or breakdown.
The current trading range reflects a standoff between bulls and bears. On one side, a decisive move above $115,000 could trigger a cascade of short liquidations – commonly known as a short squeeze – potentially sending prices sharply higher. On the other, a drop below $106,000 could activate long liquidations, accelerating downward momentum. This dynamic creates an environment where every tick toward these levels is watched with heightened anticipation.
Bitcoin Technical Analysis Chart
Analysis by Marcus Doyle | Symbol: BINANCE:BTCUSDT | Interval: 1D | Drawings: 5
Technical Analysis Summary
Start by drawing horizontal lines at the clear liquidity heatmap levels: $115,000 (major resistance) and $106,000 (major support). Mark the current price at $113,599 with a horizontal line for reference. Draw a rectangle to highlight the consolidation zone between $106,000 and $115,000 observed since late September. Use trend lines to capture the shifting medium-term trend: a downtrend from the October peak (~$125,000) to the recent low (~$107,000), and a short-term uptrend from the recent local bottom in late October to the current price. Annotate the chart with callouts noting the tight range and the risk of breakout/breakdown at these key liquidity zones.
Risk Assessment: medium
Analysis: The market is in a tight consolidation with volatility expected to increase sharply on a break of key levels. While the range offers defined risk, false breakouts are possible. Wait for confirmation and manage risk tightly.
Marcus Doyle’s Recommendation: Remain patient. Avoid chasing price within the range. Prepare for volatility at $115,000 and $106,000. Use alerts and tight stops. If a confirmed breakout occurs, act decisively but don’t over-leverage.
Key Support & Resistance Levels
📈 Support Levels:
-
$106,000 – Major liquidity-driven support zone, as identified by the current heatmap.
strong
📉 Resistance Levels:
-
$115,000 – Major resistance and liquidation risk zone, as identified by the heatmap.
strong
Trading Zones (medium risk tolerance)
🎯 Entry Zones:
-
$115,100 – Entry on breakout above $115,000 resistance with confirmation; potential short squeeze trigger.
medium risk -
$105,900 – Entry on breakdown below $106,000 support with confirmation; potential for long liquidations.
medium risk
🚪 Exit Zones:
-
$114,900 – Profit target just below resistance if long from lower range.
💰 profit target -
$106,100 – Stop-loss for long positions on breakdown of key support.
🛡️ stop loss
Technical Indicators Analysis
📊 Volume Analysis:
Pattern: Volume likely declining during sideways consolidation; expect spike on breakout.
Use callout to highlight low volume in range, anticipate surge on breakout.
📈 MACD Analysis:
Signal: Likely converging/flat in consolidation; watch for bullish or bearish crossover post-breakout.
Draw text or callout to indicate MACD flattening and importance of monitoring for fresh momentum signals.
Applied TradingView Drawing Utilities
This chart analysis utilizes the following professional drawing tools:
Disclaimer: This technical analysis by Marcus Doyle is for educational purposes only and should not be considered as financial advice.
Trading involves risk, and you should always do your own research before making investment decisions.
Past performance does not guarantee future results. The analysis reflects the author’s personal methodology and risk tolerance (medium).
Understanding Liquidity Heatmaps: The Trader’s Secret Weapon
A liquidity heatmap offers traders an invaluable visual representation of where large concentrations of orders exist in the market. Think of it as an early-warning radar for volatility: yellow zones signal high liquidation risk and heavy order flow, while blue areas indicate lower liquidity and less trading interest.
According to sources like BloFin and CoinGlass, these heatmaps help identify not just support and resistance levels but also where forced liquidations might occur if prices breach certain thresholds. Professional traders use this data to anticipate market traps – situations where sudden moves force leveraged positions to unwind rapidly.
How Pro Traders Use Bitcoin Liquidity Heatmaps
-
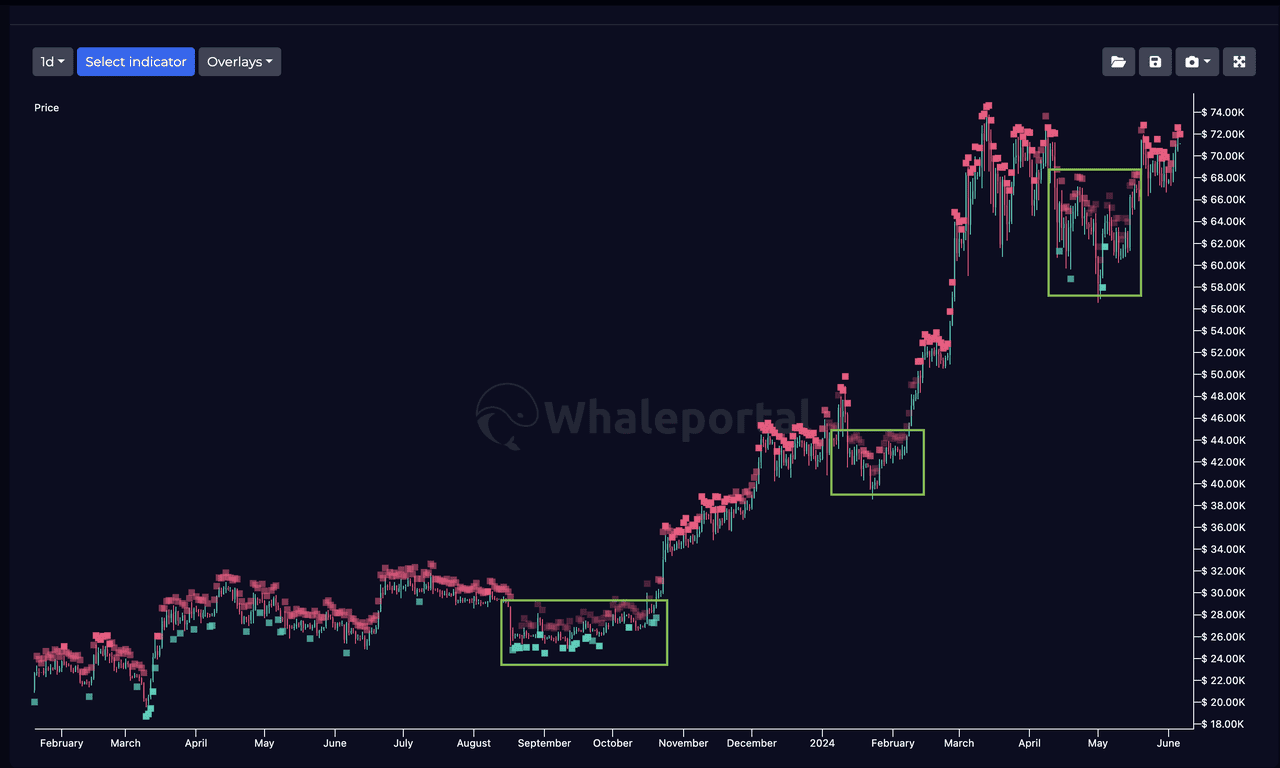
Anticipating Volatility Triggers: By monitoring clusters of liquidation levels, traders prepare for sudden moves. For example, a break above $115,000 could trigger a short squeeze, while a drop below $106,000 might spark long liquidations.
-
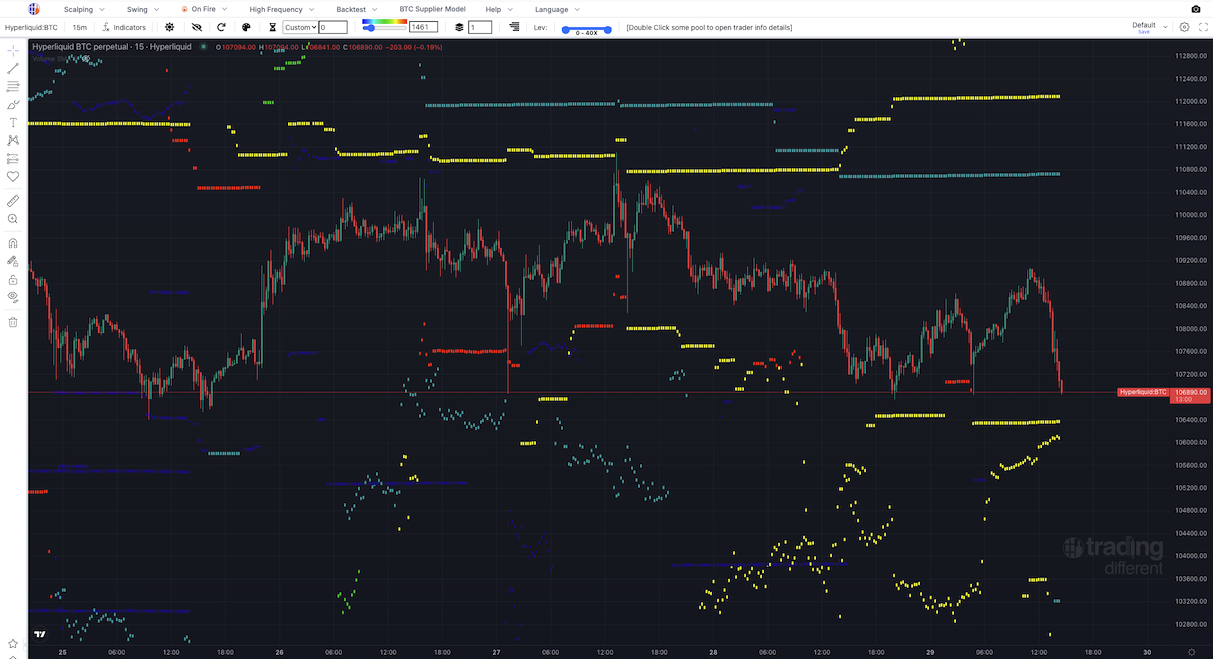
Timing Entries and Exits: Heatmaps help pros time their trades by showing when price approaches major liquidity pools, allowing them to enter before a breakout or exit before a reversal.
-
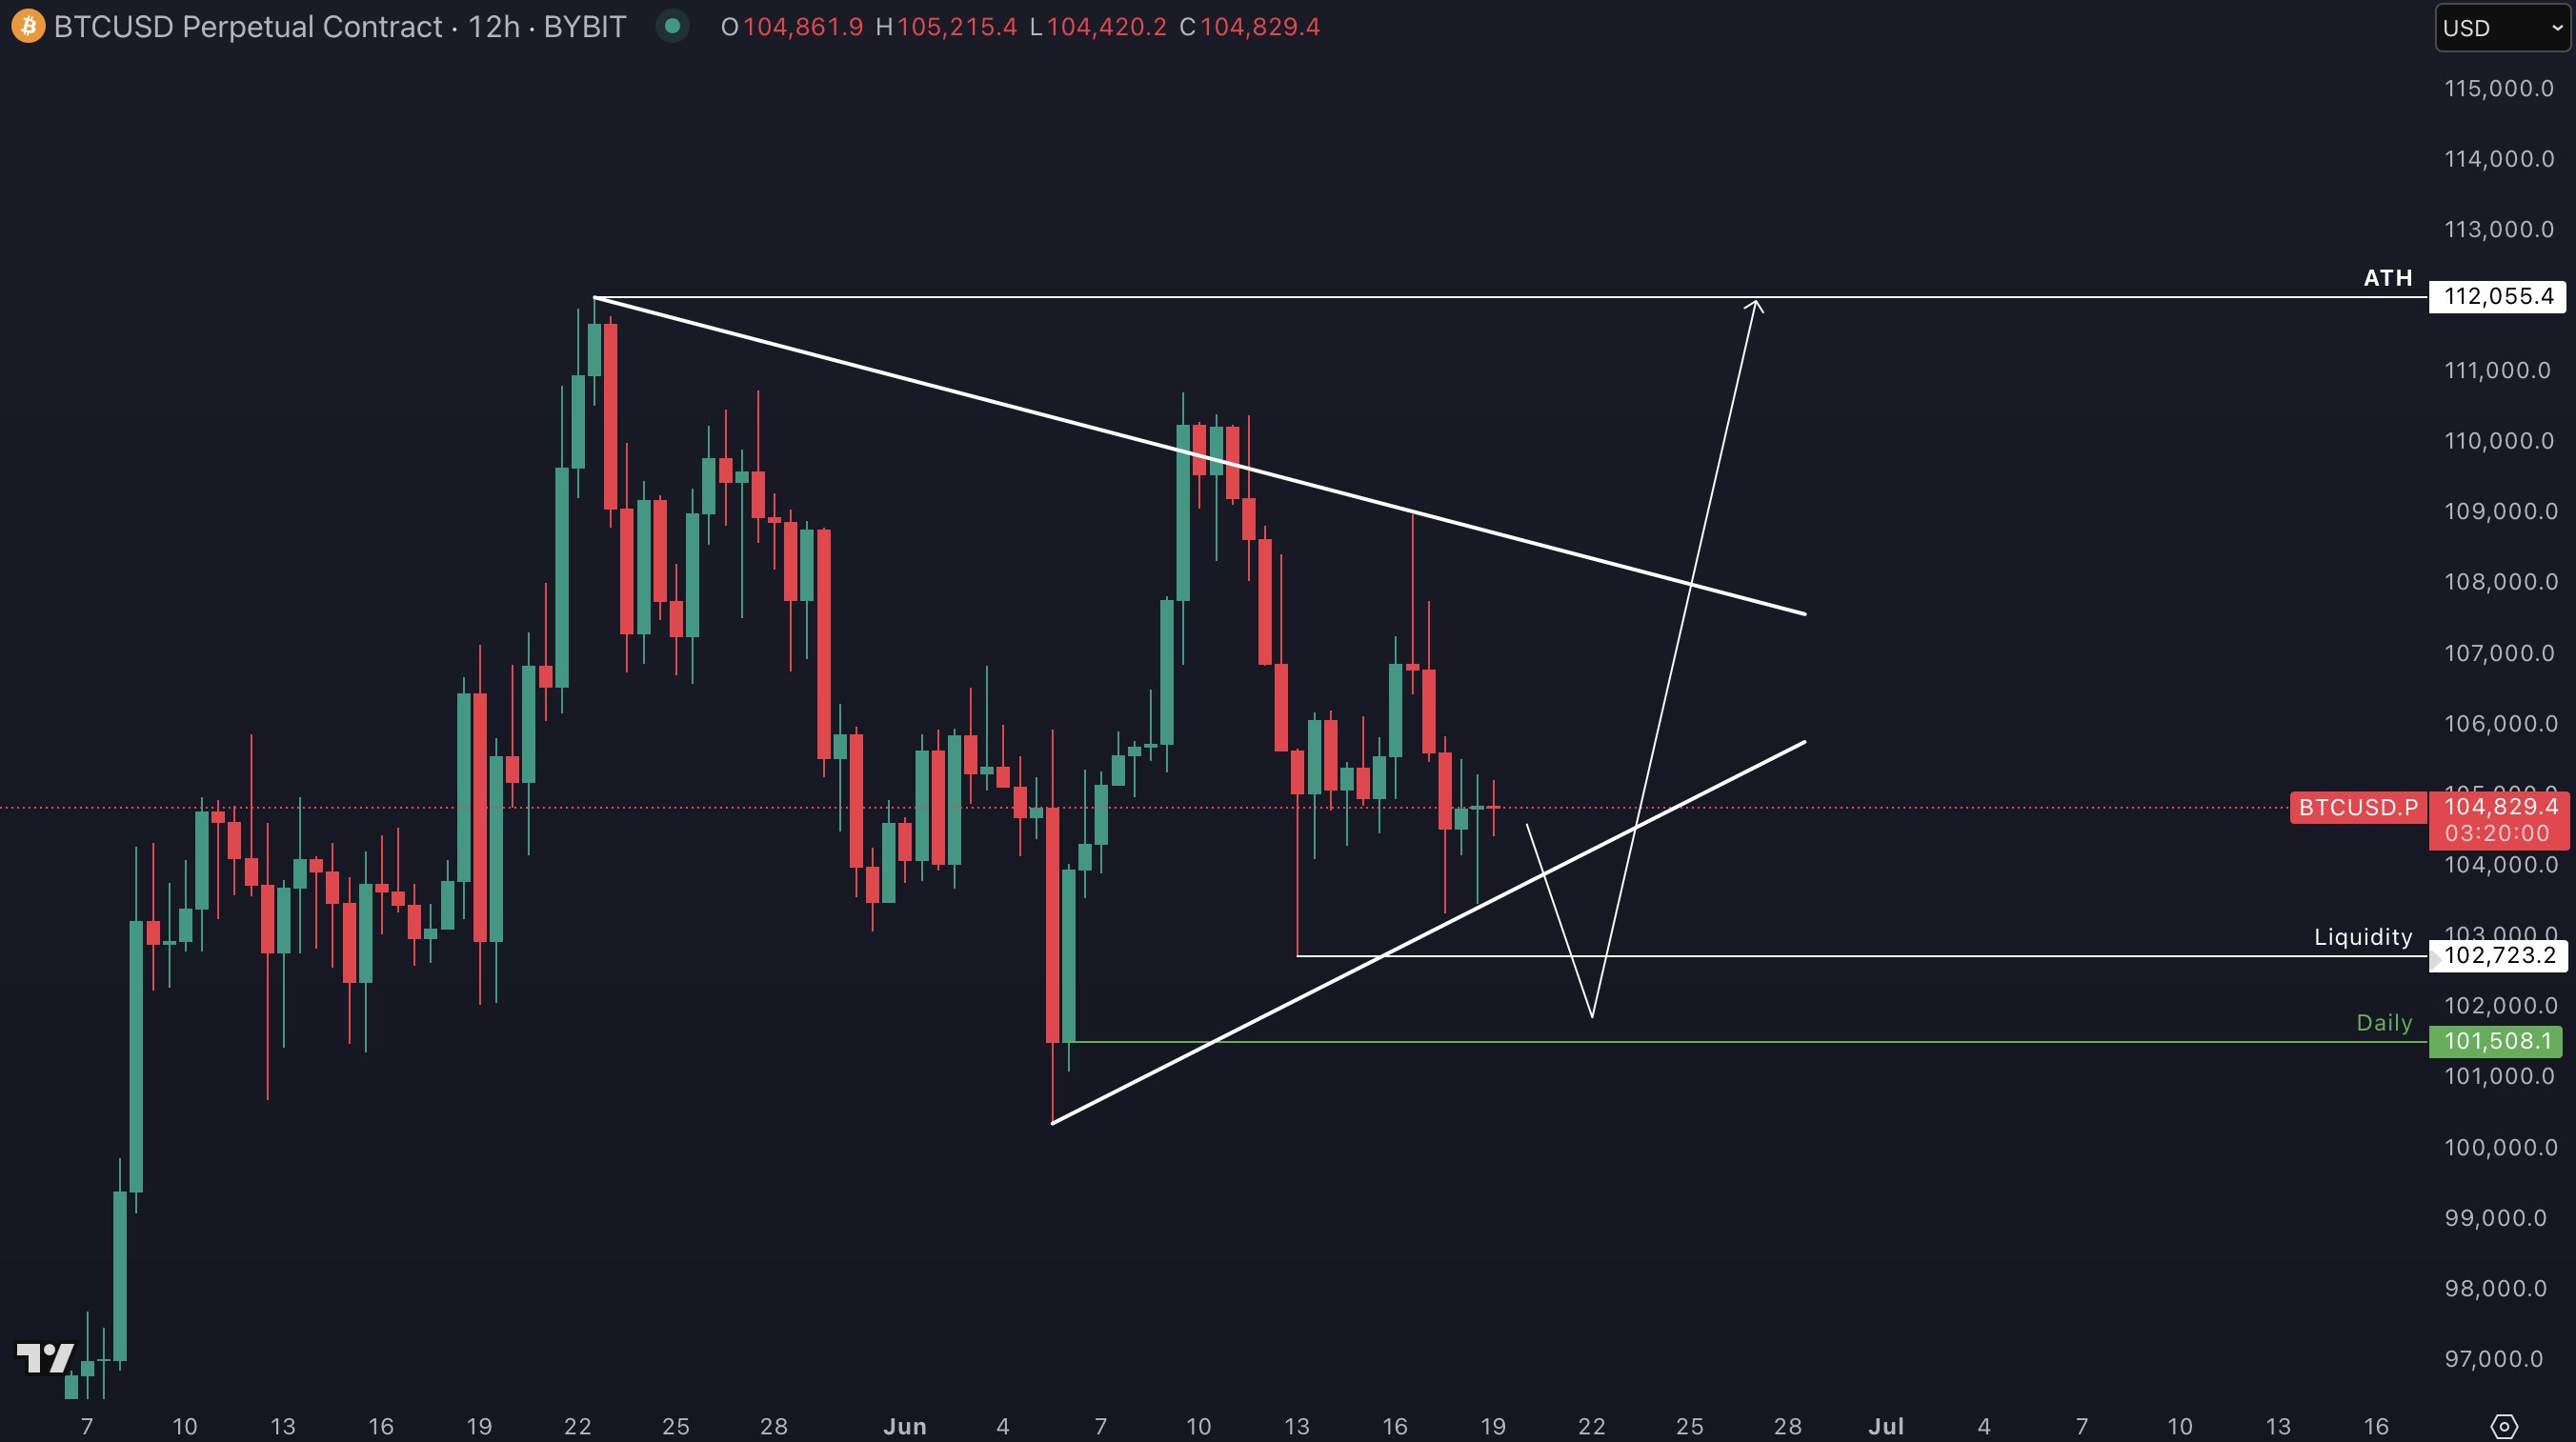
Avoiding Market Traps: Platforms like Whaleportal and TradingView enable traders to spot potential fakeouts or traps, as price often gravitates toward high-liquidity zones before reversing.
-
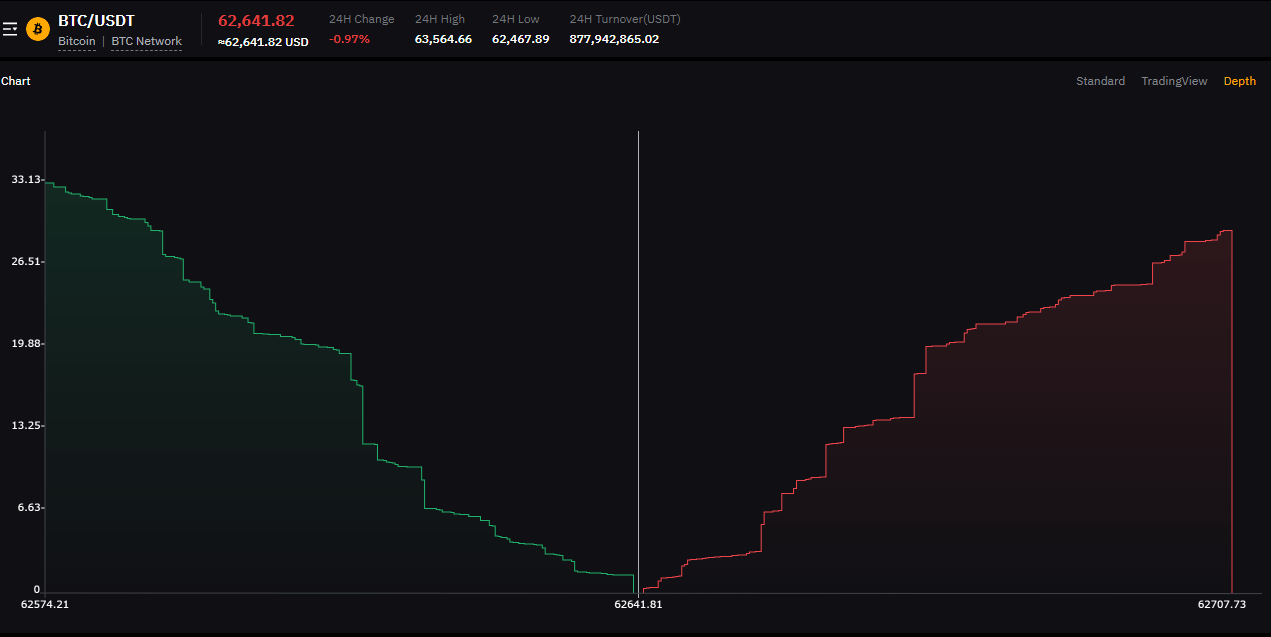
Building Adaptive Strategies: By integrating real-time heatmap data with other technical tools, pro traders adjust their strategies dynamically to capitalize on shifting liquidity and volatility.
The beauty of this tool lies in its ability to condense complex order book dynamics into actionable intelligence. By tracking shifts in liquidity clusters over time, savvy investors can spot when accumulation or distribution is taking place beneath the surface – often before it becomes obvious on standard price charts.
Spotlight on Current Market Structure: BTC at $113,599
The significance of Bitcoin’s current position cannot be overstated. With price oscillating between two major liquidity walls – $115,000 above and $106,000 below – we’re witnessing classic consolidation behavior that frequently precedes explosive moves. This makes now an especially critical moment for anyone considering buying Bitcoin securely or seeking optimal entry points.
“The battle lines are drawn around key liquidity zones. When one side gives way, expect fireworks. “
Bitcoin (BTC) Price Prediction 2026-2031
Professional outlook based on current heatmap data, market cycles, and evolving crypto fundamentals
| Year | Minimum Price | Average Price | Maximum Price | Year-over-Year Change (%) | Market Scenario Insights |
|---|---|---|---|---|---|
| 2026 | $98,000 | $128,000 | $163,000 | +12.7% | Potential post-halving volatility and regulatory headwinds could cause sharp swings. If key liquidity at $115K is breached, strong bullish momentum is likely. |
| 2027 | $113,000 | $147,000 | $188,000 | +14.8% | Mainstream adoption and ETF inflows may drive new highs; however, competition from altcoins and possible macroeconomic tightening could temper gains. |
| 2028 | $130,000 | $172,000 | $213,000 | +17.0% | New cycle highs are probable if institutional adoption continues. Technological upgrades (e.g., Layer 2, privacy features) could enhance utility and price support. |
| 2029 | $150,000 | $193,000 | $242,000 | +12.2% | Global regulatory clarity and integration with traditional finance could sustain upward momentum. Bearish scenario: macro downturn or major hacks could test support. |
| 2030 | $167,000 | $217,000 | $278,000 | +12.4% | Potential for Bitcoin as a digital store of value to be cemented. Bullish scenario: adoption in emerging markets and increased scarcity post-halving. |
| 2031 | $180,000 | $241,000 | $315,000 | +11.1% | Market maturity and network effects drive steady growth. Bearish risks: competition from CBDCs or disruptive blockchain tech. Bullish: global reserve asset narrative. |
Price Prediction Summary
Bitcoin is expected to break out of its current consolidation range in the coming years, driven by key liquidity events, continued institutional adoption, and periodic halving cycles. While the path will include both bullish rallies and corrective phases, the overall trend points to progressive growth with heightened volatility at key inflection points.
Key Factors Affecting Bitcoin Price
- Liquidity heatmap zones ($115,000 resistance, $106,000 support) as catalysts for major moves
- Halving cycles and supply shocks
- Institutional inflows (ETFs, corporate treasuries)
- Global regulatory clarity or restrictions
- Technological upgrades (scalability, privacy, DeFi integration)
- Macro-economic factors: inflation, interest rates, and risk appetite
- Competition from other cryptocurrencies and CBDCs
Disclaimer: Cryptocurrency price predictions are speculative and based on current market analysis.
Actual prices may vary significantly due to market volatility, regulatory changes, and other factors.
Always do your own research before making investment decisions.
As uncertainty mounts and order books thicken at these pivotal levels, traders should remain vigilant. The compression of volatility often leads to sudden expansion once one side gains control – making this one of the most exciting setups we’ve seen so far in 2025.
For those tracking Bitcoin price analysis and seeking the best time to buy Bitcoin, the current environment is a textbook example of how patience and preparation pay off. The liquidity heatmap for Bitcoin doesn’t just highlight where the action will be, it shows where market psychology is most fragile. When price hovers near these critical bands, even a minor catalyst can unleash dramatic moves as leveraged traders are forced to unwind their positions.
How to Use Liquidity Heatmaps for Smarter Entries
If you’re aiming to buy Bitcoin securely, leveraging liquidity heatmap insights can give you an edge. Here’s how experienced traders approach the setup:
Strategic Entry Points Using Bitcoin Liquidity Heatmaps
-
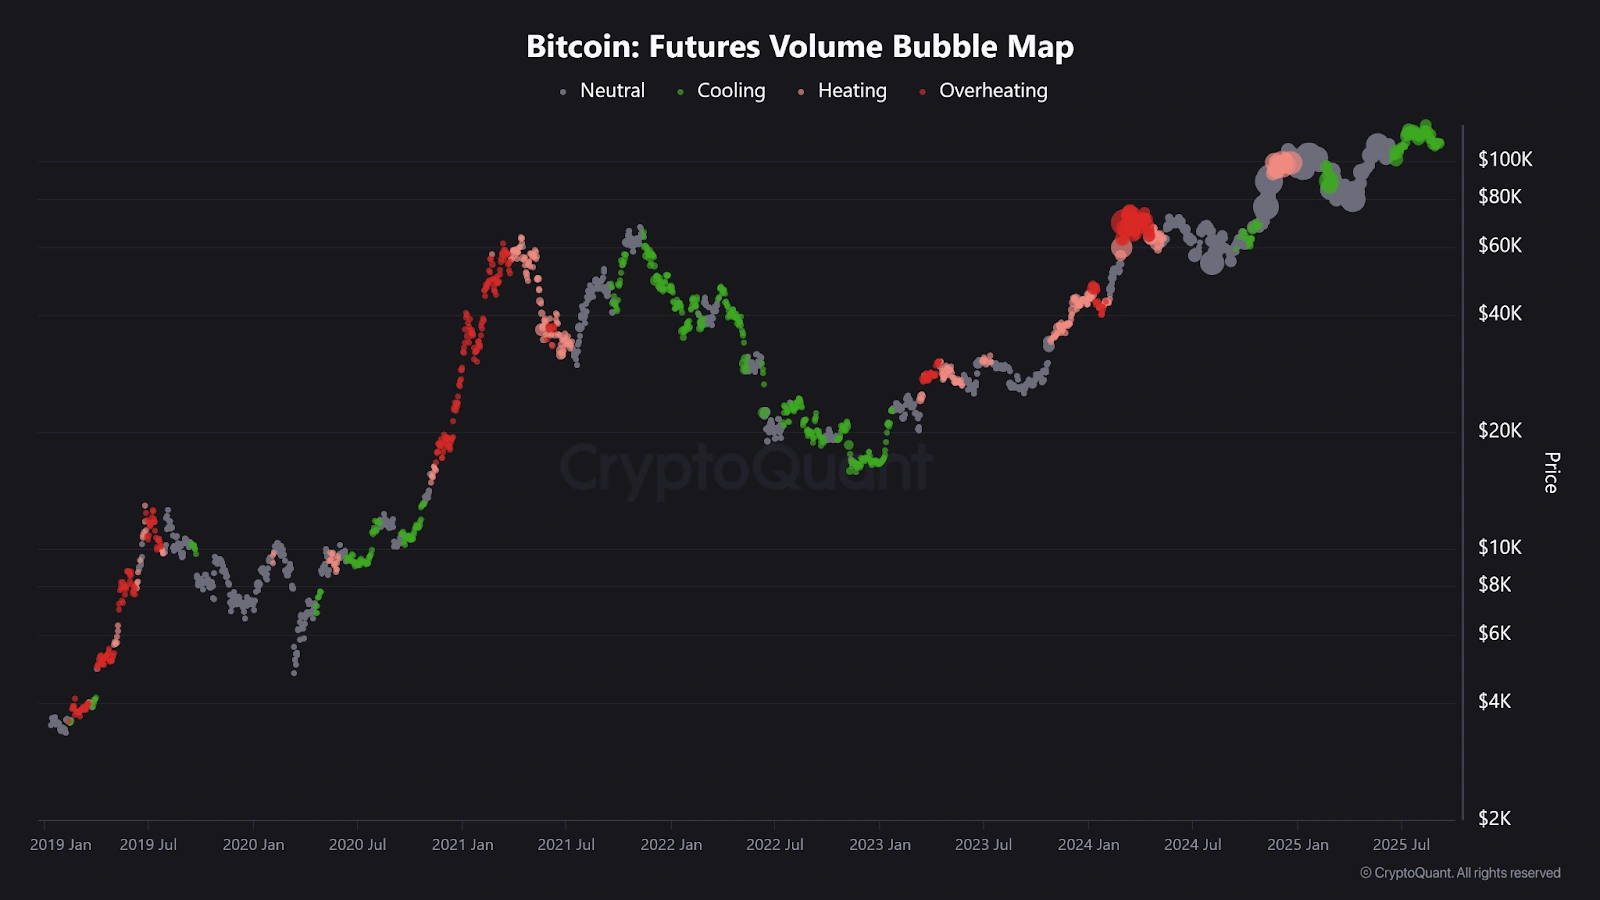
Spotting High-Liquidity Zones: $115,000 & $106,000Recent Bitcoin liquidity heatmaps highlight key liquidity clusters at $115,000 and $106,000. These levels represent major concentrations of buy and sell orders, acting as critical support and resistance. Monitoring price action around these zones can reveal optimal entry points for both breakout and reversal trades.
-
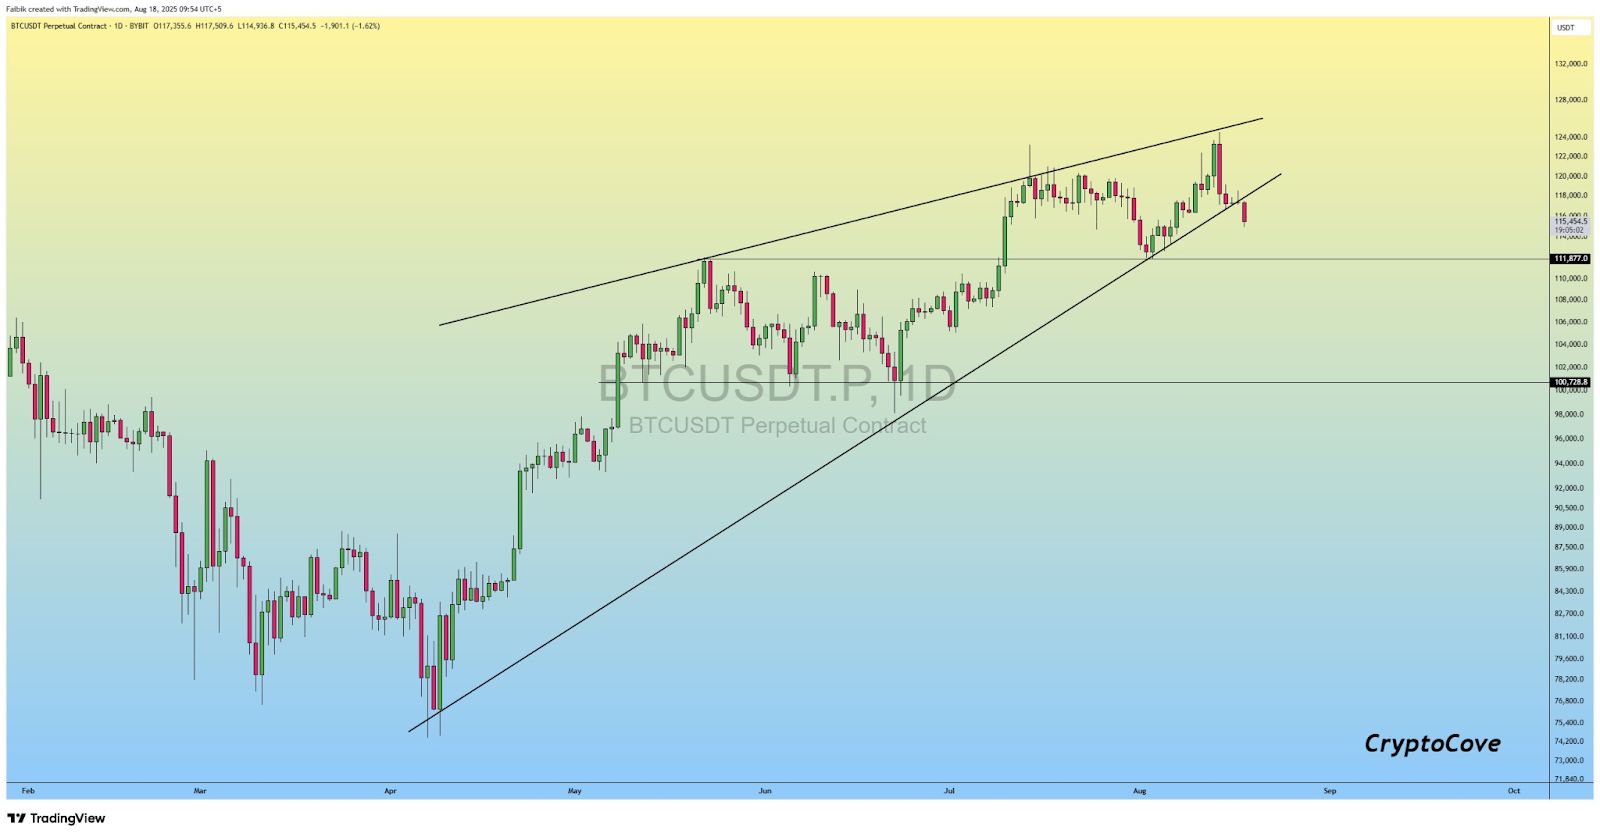
Watching for Breakouts Above ResistanceA break above the $115,000 liquidity zone could trigger a short squeeze, rapidly pushing Bitcoin higher. Traders often set alerts for such breakouts, as they may signal the start of a new upward trend and present a strong buying opportunity.
-
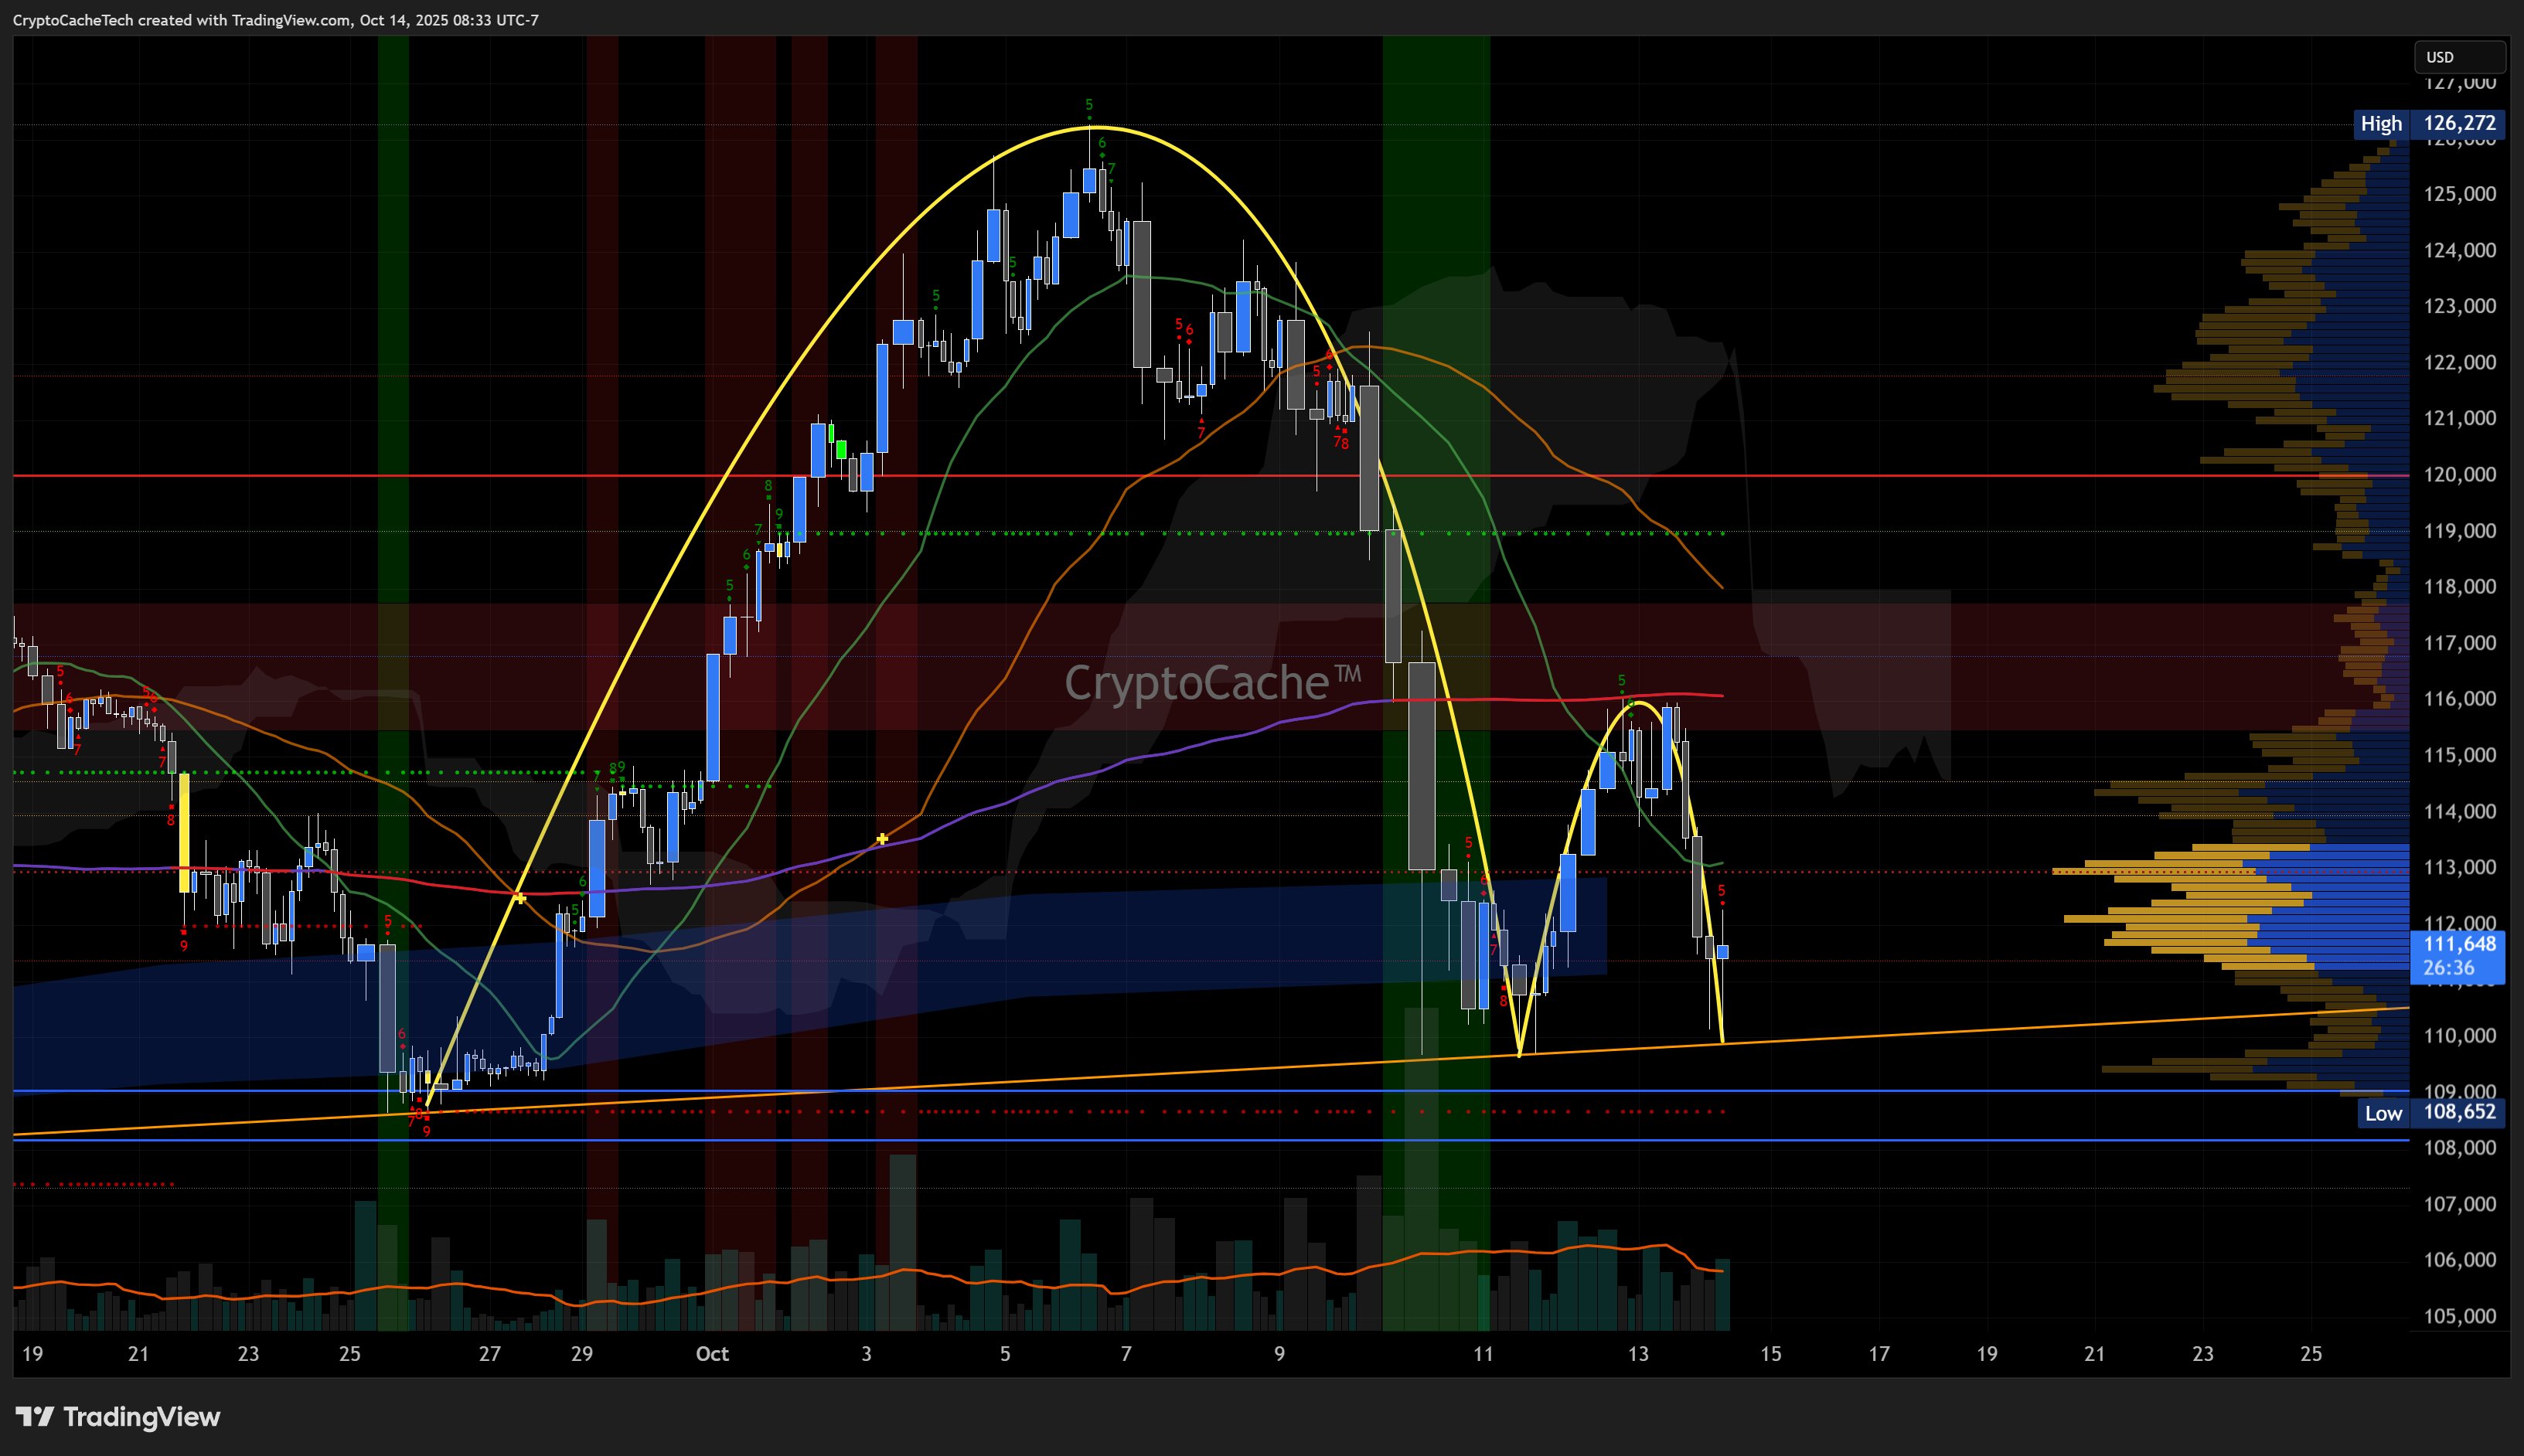
Anticipating Liquidation Cascades Below SupportIf Bitcoin drops below the $106,000 support zone, it could lead to a wave of long liquidations and further price declines. Savvy traders use heatmaps to identify these risk zones and plan strategic entries after potential liquidation events, when volatility peaks and prices may rebound.
-
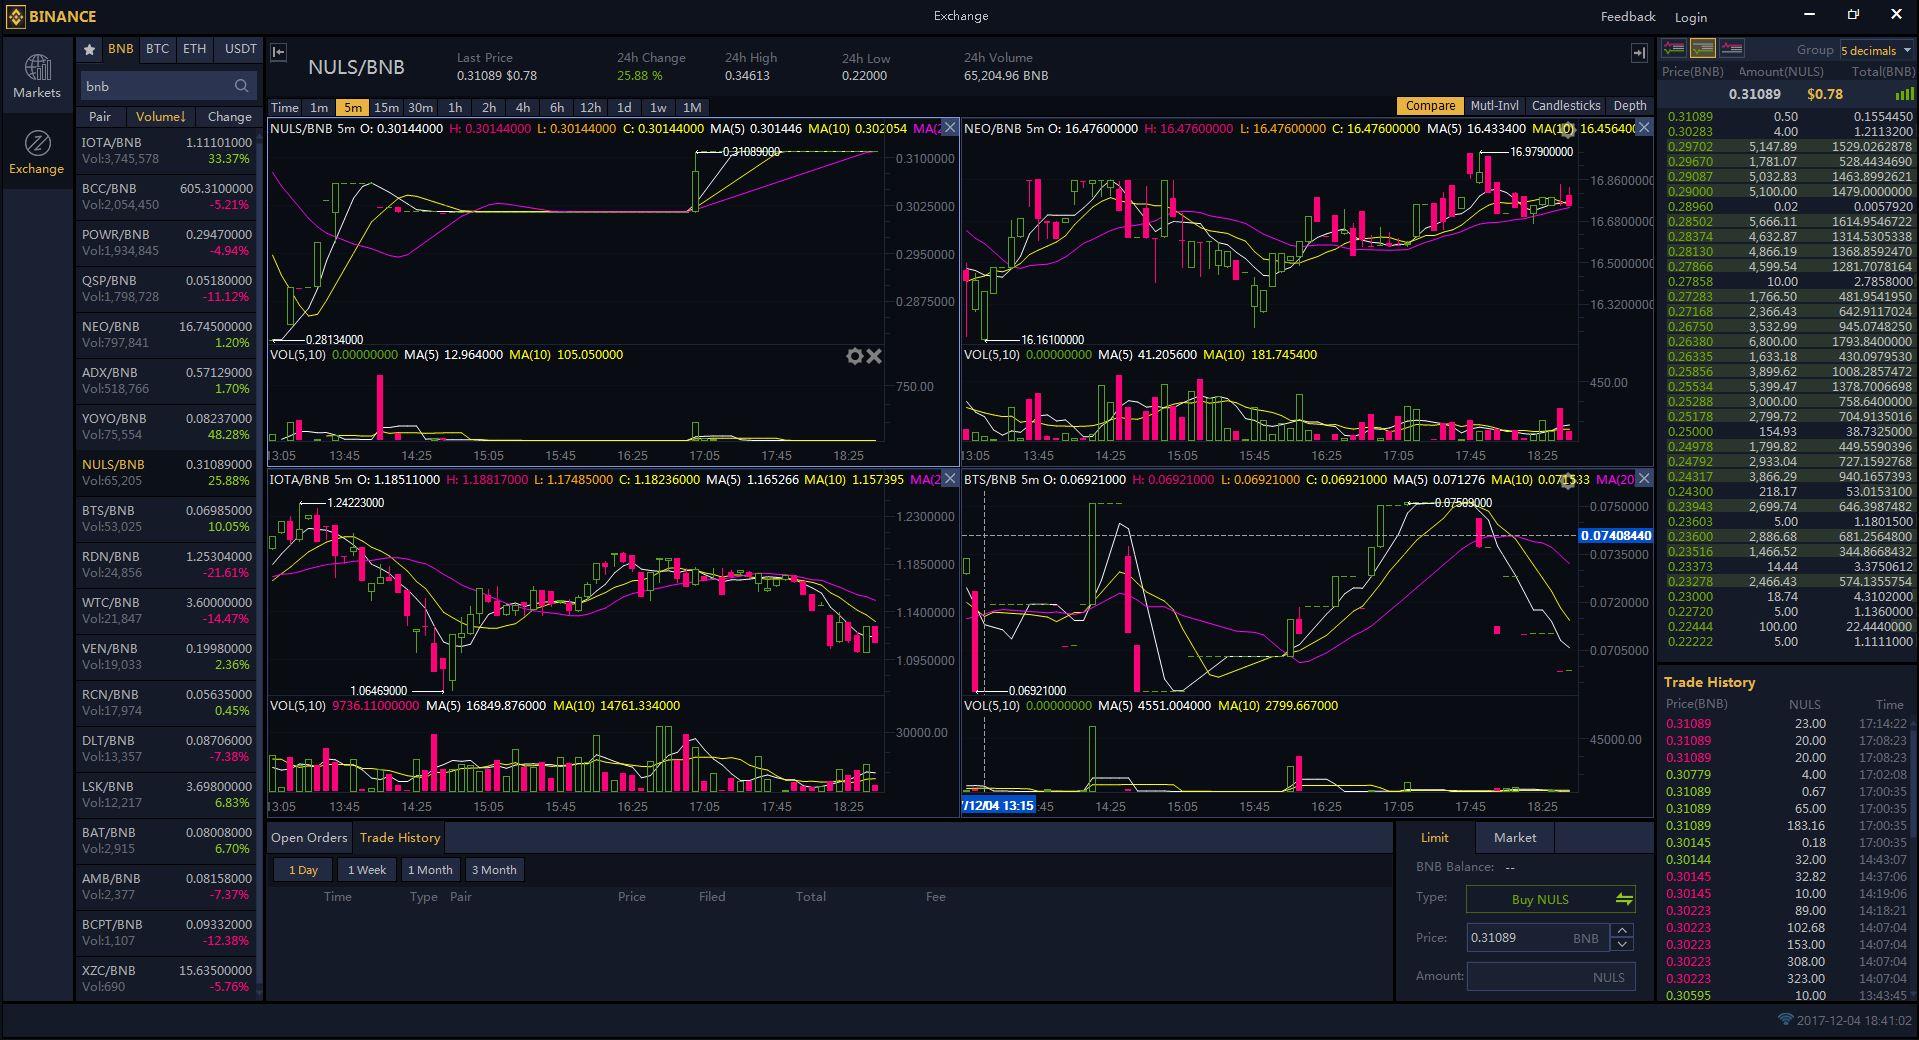
Using Real-Time Heatmap PlatformsPlatforms like Bookmap, CoinGlass, and TradingView offer real-time Bitcoin liquidity heatmaps. These tools visualize order flow and liquidity clusters, helping traders spot emerging entry points as market conditions evolve.
-
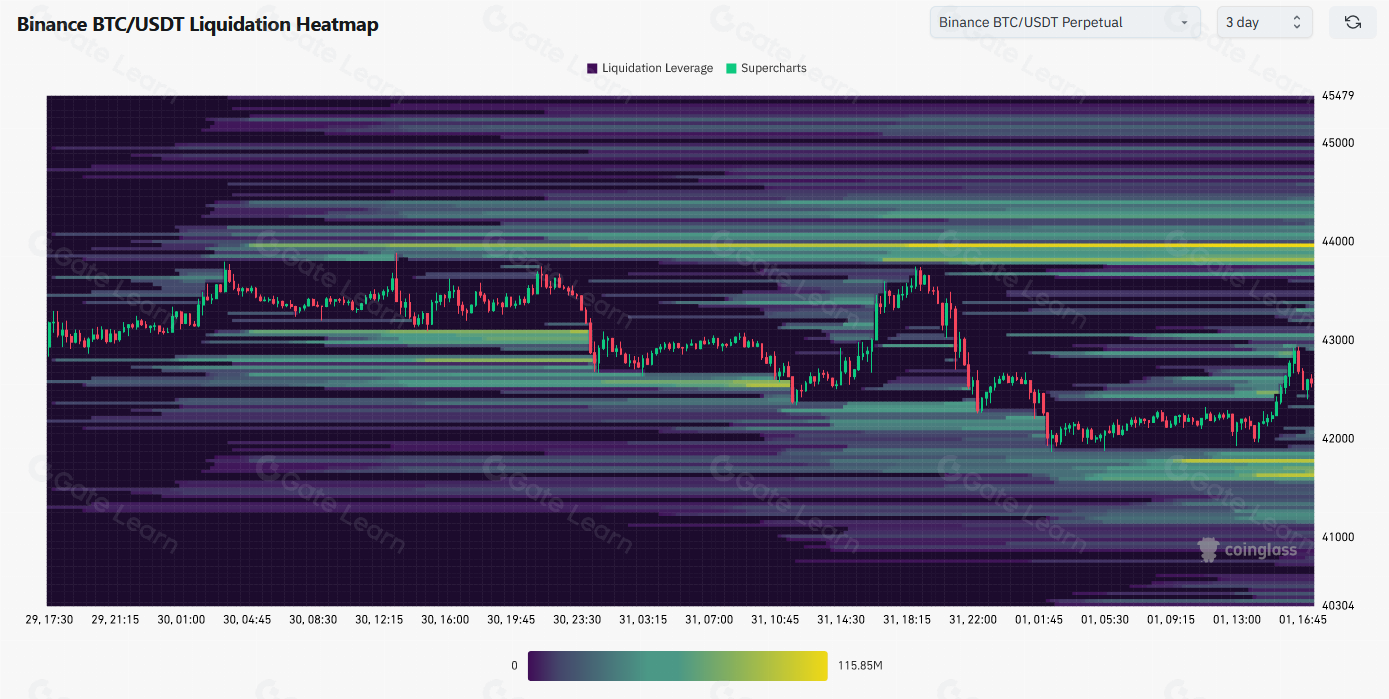
Combining Heatmap Data with Market StructurePro traders overlay liquidity heatmap data with classic support/resistance analysis to confirm high-probability entry points. This adaptive approach increases confidence when entering trades in tight ranges like the current one around $113,599.
First, monitor the evolving liquidity clusters on platforms like CoinGlass or Bookmap. If you see growing order size at $115,000, it’s a sign that sellers are defending this level, yet if price approaches and volume surges, watch for a potential breakout as shorts scramble to cover. Conversely, heavy bids near $106,000 may provide short-term support, but a breakdown could trigger cascading liquidations and present a discounted entry point for long-term investors.
During tight ranges like this one, where BTC trades at $113,599: consolidation often masks underlying accumulation or distribution by large players. As volatility compresses and the market coils tighter, each test of support or resistance becomes more meaningful. This is when order flow insights from heatmaps become crucial for timing entries rather than chasing momentum after a breakout.
What Triggers the Breakout? Signals to Watch
The path out of consolidation usually comes with a surge in volume and an uptick in liquidations at one of the major zones. Watch for:
- Sustained volume spikes as BTC nears $115,000 or $106,000
- Heatmap color shifts indicating new clusters of orders forming above or below current price
- Order book thinning, which often precedes sharp directional moves when liquidity evaporates
- Sentiment shifts on social media and trading forums, as retail traders react en masse to initial price movements

This is where understanding the latest heatmap data becomes invaluable: it not only pinpoints likely inflection points but also reveals where risk is concentrated in the market structure.
Opportunity Amidst Volatility: Adaptive Strategies for 2025
The lesson from previous cycles, and especially during periods like now, is that volatility is opportunity in disguise. Traders who use liquidity heatmaps as part of their toolkit can avoid common traps set by sudden wicks or fakeouts that target leveraged positions clustered around obvious levels.
If you’re considering entering the market during this phase of cryptocurrency market volatility:
- Set alerts near key levels ($115,000 and $106,000) so you’re ready to act quickly when momentum builds.
- Avoid overleveraging; tight ranges can lead to sudden liquidation spikes on both sides.
- Diversify your entries instead of going all-in at one level, layering bids allows you to adapt if volatility expands unexpectedly.
- Pace yourself: consolidation phases can last longer than expected before resolving decisively.
The coming days could define Bitcoin’s trajectory into year-end. Whether it’s an upside breakout above $115,000 triggering rapid gains or a sweep below $106,000 offering discounted accumulation opportunities, staying informed through real-time data gives you an adaptive edge in all markets.


