Imagine standing at the edge of a bustling crypto marketplace, coins whizzing past, charts pulsing with energy, and traders from every corner of the globe hunting for their next big move. The timeless mantra—buy at support, sell at resistance—echoes through the digital bazaar, promising simplicity in a world that often feels anything but simple. Yet, for beginners willing to learn the ropes, this approach can become a reliable compass in the wilds of crypto trading.

Spotting Support and Resistance Like a Pro
The first step is learning how to identify key support and resistance levels using volume and price action. These are not just random lines scribbled across your favorite coin’s chart—support is where buyers repeatedly step in to stop prices from falling further, while resistance is where sellers consistently block upward momentum. To find these zones:
3 Actionable Strategies for Spotting Support & Resistance
-
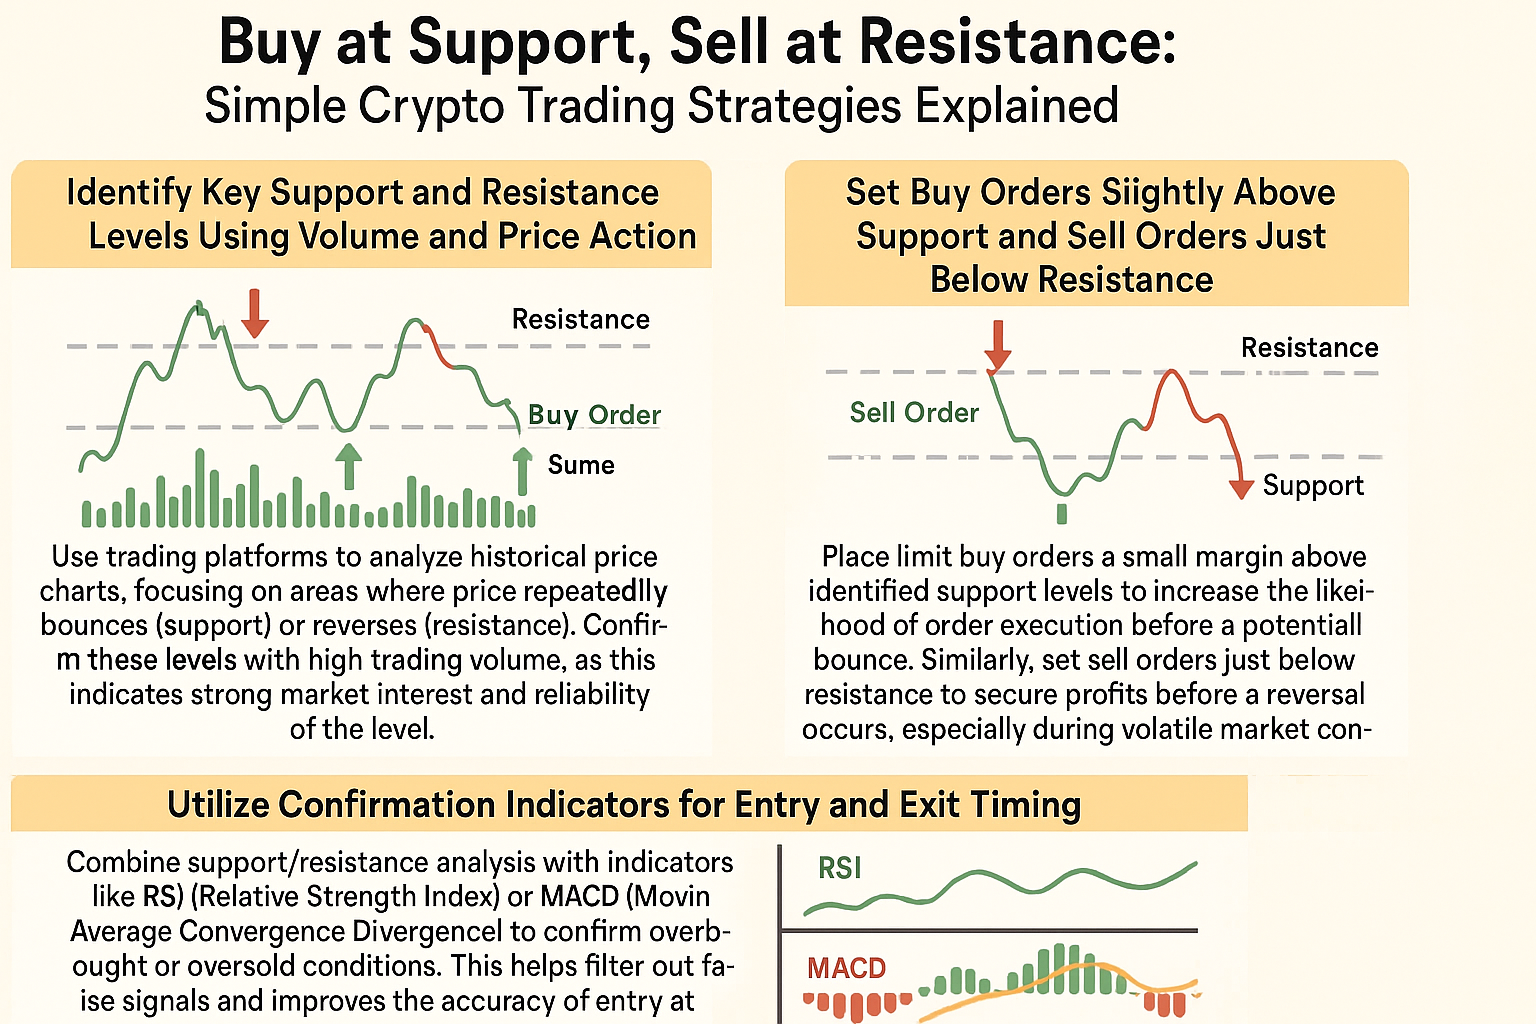
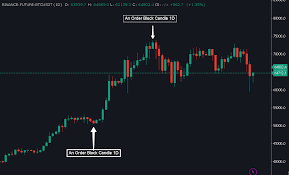
Identify Key Support and Resistance Levels Using Volume and Price Action: Use established trading platforms like TradingView or Binance to analyze historical price charts. Focus on areas where the price has repeatedly bounced upward (support) or reversed downward (resistance). Confirm these levels by looking for volume spikes—high trading volume at these zones suggests strong market interest and makes the level more reliable.
-
Set Buy Orders Slightly Above Support and Sell Orders Just Below Resistance: Place limit buy orders a small margin above identified support levels to boost your chances of catching a bounce before the price moves up. Likewise, set sell orders just below resistance to lock in profits before a potential reversal, especially in volatile conditions. Most major exchanges like Coinbase Advanced Trade and Kraken offer these order types.
-
Utilize Confirmation Indicators for Entry and Exit Timing: Combine your support/resistance analysis with popular indicators like RSI (Relative Strength Index) or MACD (Moving Average Convergence Divergence). These tools, available on platforms such as TradingView, help confirm whether an asset is overbought or oversold. This extra confirmation filters out false signals and boosts your accuracy when entering at support or exiting at resistance.
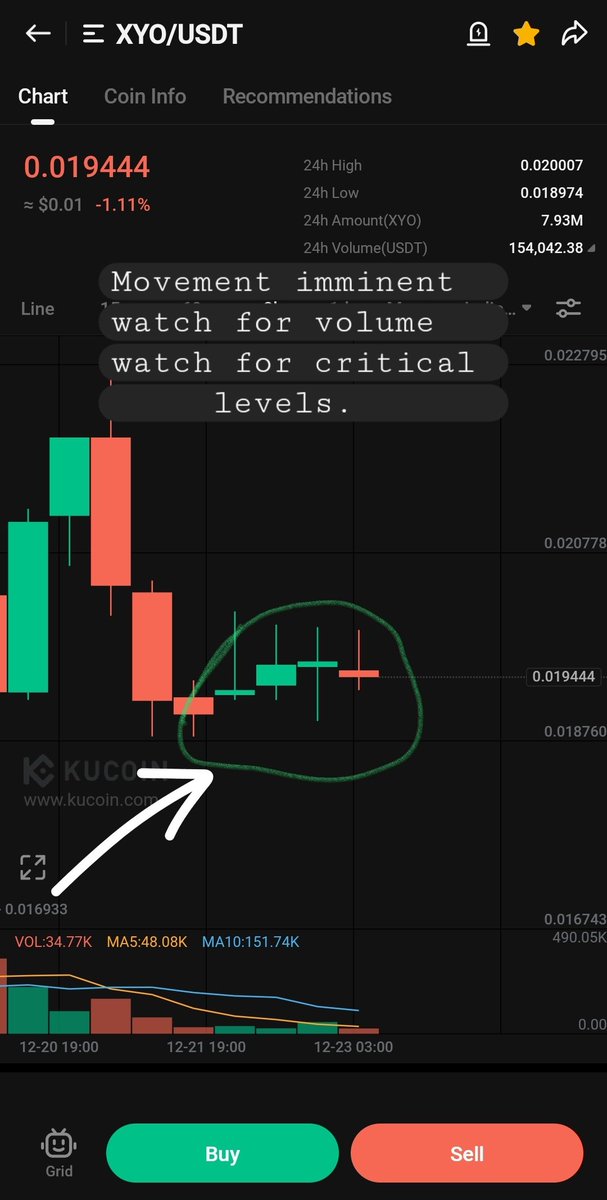
Volume is your secret weapon here. When you see price bouncing off a level with heavy trading volume, it’s a strong clue that many traders agree on its significance. This consensus turns those levels into psychological battlegrounds—places where reversals are likely to happen.
Strategic Order Placement: The Art of Precision
Once you’ve mapped out your support and resistance zones, it’s time for tactical execution. Rather than chasing price or setting orders right on the line (where everyone else might be), set buy orders slightly above support and sell orders just below resistance. This margin increases your chances of catching the move before others react—and helps avoid getting left behind if price narrowly misses your target.
- Buy at Support Crypto: Place limit buy orders just above strong support levels identified by previous bounces and high volume.
- Sell at Resistance Strategy: Set limit sell orders just below major resistance points to lock in gains before potential reversals—especially helpful during volatile swings.
This method isn’t about greed—it’s about being practical. In fast-moving markets, waiting for perfection can mean missing out entirely!
Mastering Support & Resistance: A Step-by-Step Crypto Trading Adventure


The Power of Confirmation: Don’t Go In Blind
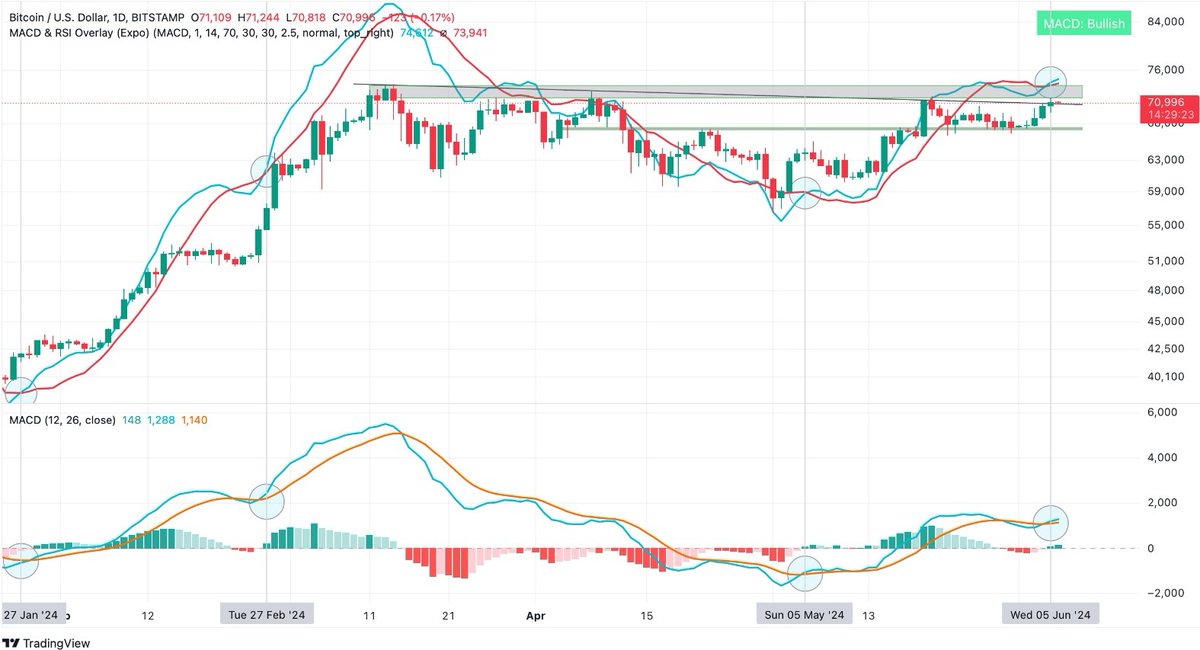
No matter how clean your lines look on the chart, relying solely on support/resistance can sometimes lead you astray. That’s why wise traders utilize confirmation indicators for entry and exit timing. Tools like RSI (Relative Strength Index) or MACD (Moving Average Convergence Divergence) help confirm whether an asset is truly overbought near resistance or oversold near support.
3 Actionable Crypto Trading Strategies for Beginners
-
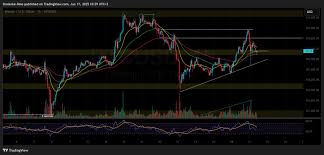
Identify Key Support and Resistance Levels Using Volume and Price Action: Use trading platforms like TradingView or Binance to analyze historical price charts. Focus on areas where price repeatedly bounces (support) or reverses (resistance). Confirm these levels with high trading volume, as this signals strong market interest and the reliability of the level.
-
Set Buy Orders Slightly Above Support and Sell Orders Just Below Resistance: Place limit buy orders a small margin above identified support levels on platforms like Coinbase or Kraken to increase the likelihood of order execution before a potential bounce. Similarly, set sell orders just below resistance to secure profits before a reversal occurs—this is especially important during volatile market conditions.
-
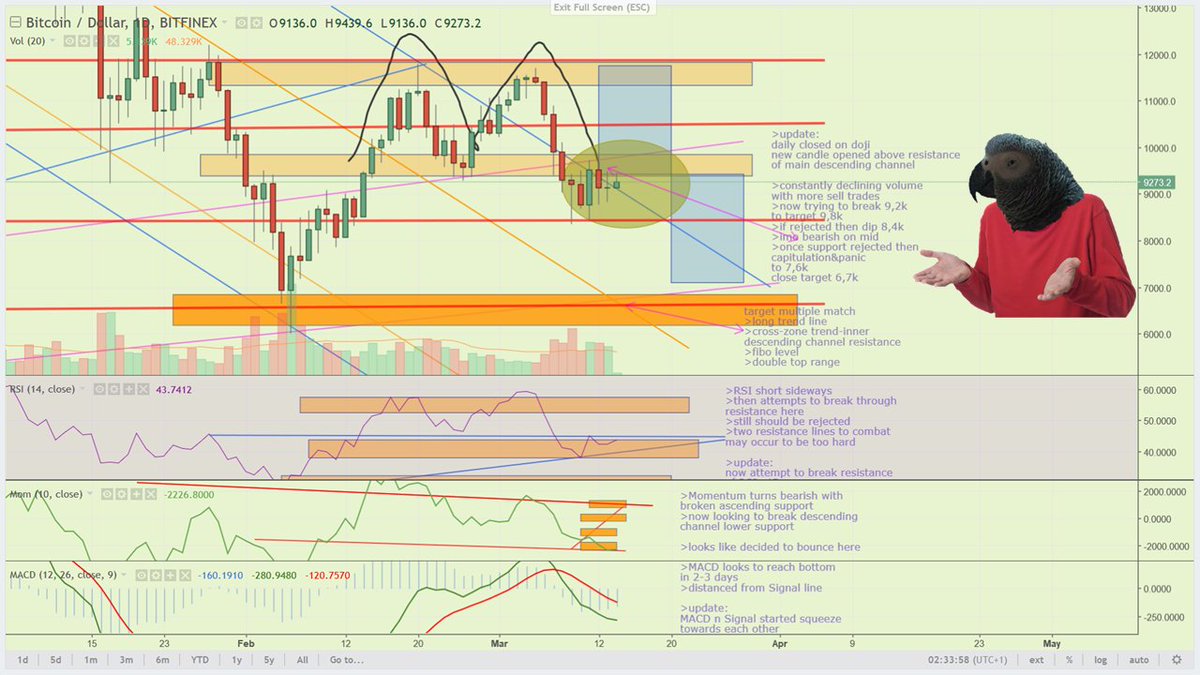
Utilize Confirmation Indicators for Entry and Exit Timing: Combine your support/resistance analysis with indicators like RSI (Relative Strength Index) or MACD (Moving Average Convergence Divergence) on platforms such as TradingView. Look for oversold RSI or bullish MACD crossovers near support for entries, and overbought RSI or bearish MACD crossovers near resistance for exits. This helps filter out false signals and improves the accuracy of your trades.
This extra layer of confirmation filters out false signals—helping you avoid costly mistakes when markets fake out before making their real move. It’s like checking both ways before crossing a busy street: a simple habit that pays off over time.