
5 Signals to Watch
Bitcoin’s volatility demands rigorous analysis before committing capital in 2026. These five signals, grounded in official on-chain data and regulatory developments, provide a framework for navigating high-stakes market shifts.
-
Bitcoin ETF Inflow Trends
Spot Bitcoin ETFs have reshaped market liquidity, making daily inflow data a critical leading indicator for price action. Unlike previous cycles driven by retail speculation, institutional capital flows now dictate short-term momentum. Watch for sustained positive net inflows into major funds like BlackRock’s IBIT or Fidelity’s FBTC, which signal genuine demand rather than speculative churn. Volatility remains high, so treat these trends as directional signals, not guarantees. -
Halving Cycle Supply Shock
The 2024 halving reduced block rewards, but its 2026 impact hinges on miner behavior and exchange reserves. Historical data suggests supply shocks peak 12-18 months post-event, yet miner selling pressure can dampen rallies if hash rates remain elevated. Monitor on-chain metrics like exchange outflows and miner reserve levels to gauge scarcity. If supply absorption outpaces new issuance, price discovery accelerates. Remember, past cycles inform but do not guarantee future returns in this high-stakes environment. -
Global Regulatory Policy Shifts
Regulatory clarity in major jurisdictions like the EU (MiCA) and the US significantly influences institutional participation. Ambiguity creates friction, while structured frameworks encourage long-term capital allocation. Track legislative developments regarding stablecoin integration and tax treatment, as these directly affect operational costs for large players. Sudden policy reversals can trigger sharp corrections, highlighting the need for agile risk management. Stay informed through official government releases and primary regulatory filings to avoid speculation-driven traps. -
Institutional Custody Adoption Rates
Adoption by Tier-1 custodians like Fidelity Digital Assets and Coinbase Custody signals maturity and security compliance. High adoption rates reduce counterparty risk, making Bitcoin more attractive to pension funds and endowments. Monitor quarterly reports from these providers for growth in assets under custody (AUC). Rising AUC often correlates with reduced circulating supply on exchanges, tightening liquidity. However, custody concentration risks exist, so diversify exposure and remain cautious of systemic vulnerabilities within the broader financial infrastructure. -

Macroeconomic Interest Rate Impact
Bitcoin often acts as a liquidity proxy, reacting inversely to real interest rates and dollar strength. When central banks signal rate cuts, risk assets typically rally due to cheaper borrowing costs and lower opportunity costs for holding non-yielding assets. Conversely, hawkish stances can suppress prices as capital flows to safer, yield-bearing instruments. Watch Federal Reserve communications and CPI data for clues on monetary policy direction. This correlation is not perfect, but it remains a primary driver of macro-level price trends in 2026.
The Market's Current Odds for Bitcoin in 2026
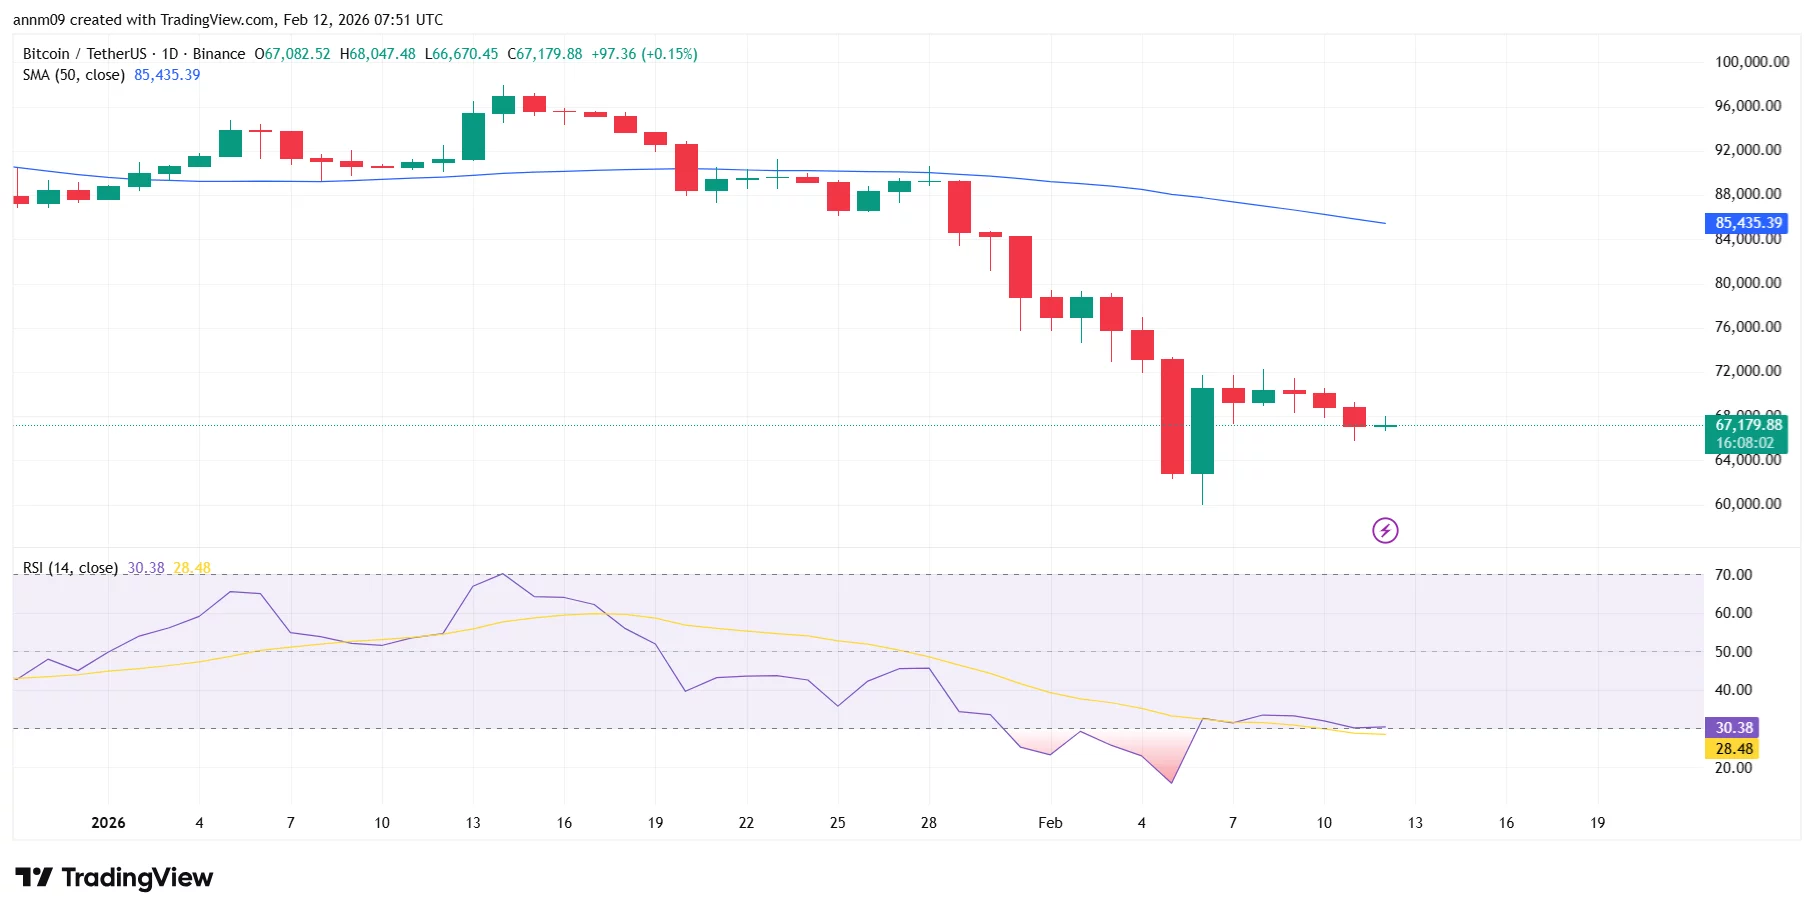
Bitcoin is currently trading in a volatile range, but the path to 2026 is defined by a sharp divergence between conservative analyst models and speculative market pricing. While traditional financial models suggest steady growth, prediction markets and algorithmic forecasts are pricing in much higher volatility and potential upside.
Conservative estimates from major platforms like Binance and Changelly place the average Bitcoin price for 2026 between $68,000 and $87,000. These models rely on historical halving cycles and steady adoption curves, suggesting a floor that remains well above current levels but rarely exceeds $90,000 without significant external catalysts.
In contrast, prediction markets are signaling much more aggressive targets. According to data from Polymarket, the market assigns a near-certain probability to Bitcoin reaching at least $90,000 before 2027, with some outcomes pointing toward $100,000 and beyond. This gap between analyst averages and market sentiment highlights the speculative nature of long-term crypto forecasting.
Understanding this spread is critical for setting realistic expectations. The "base case" for 2026 appears to be in the $70,000–$80,000 range, but the "bull case"—driven by institutional adoption and macroeconomic factors—could push prices well over $100,000. The signals we will examine next help determine which scenario is more likely.
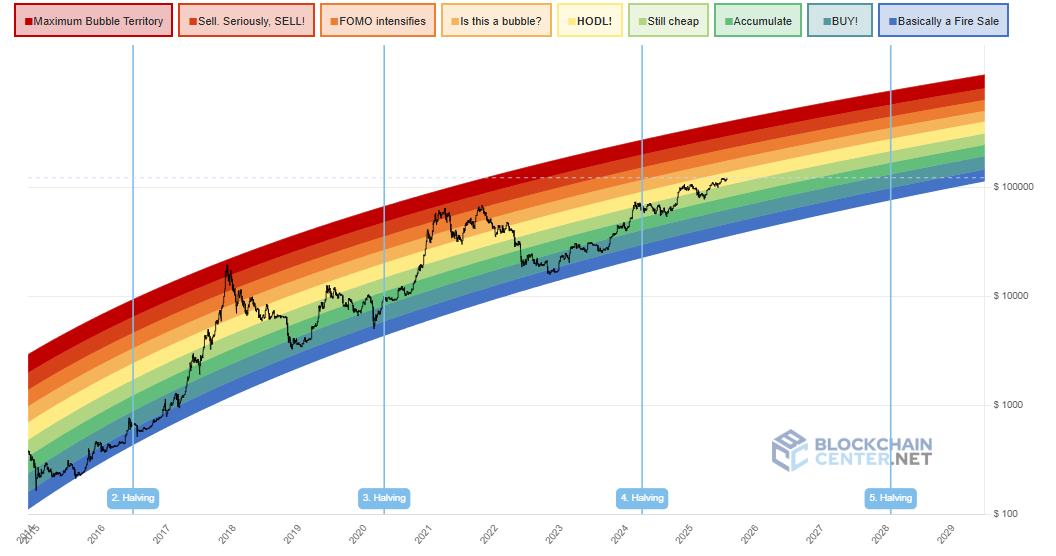
How the 2024 Halving Drives Scarcity
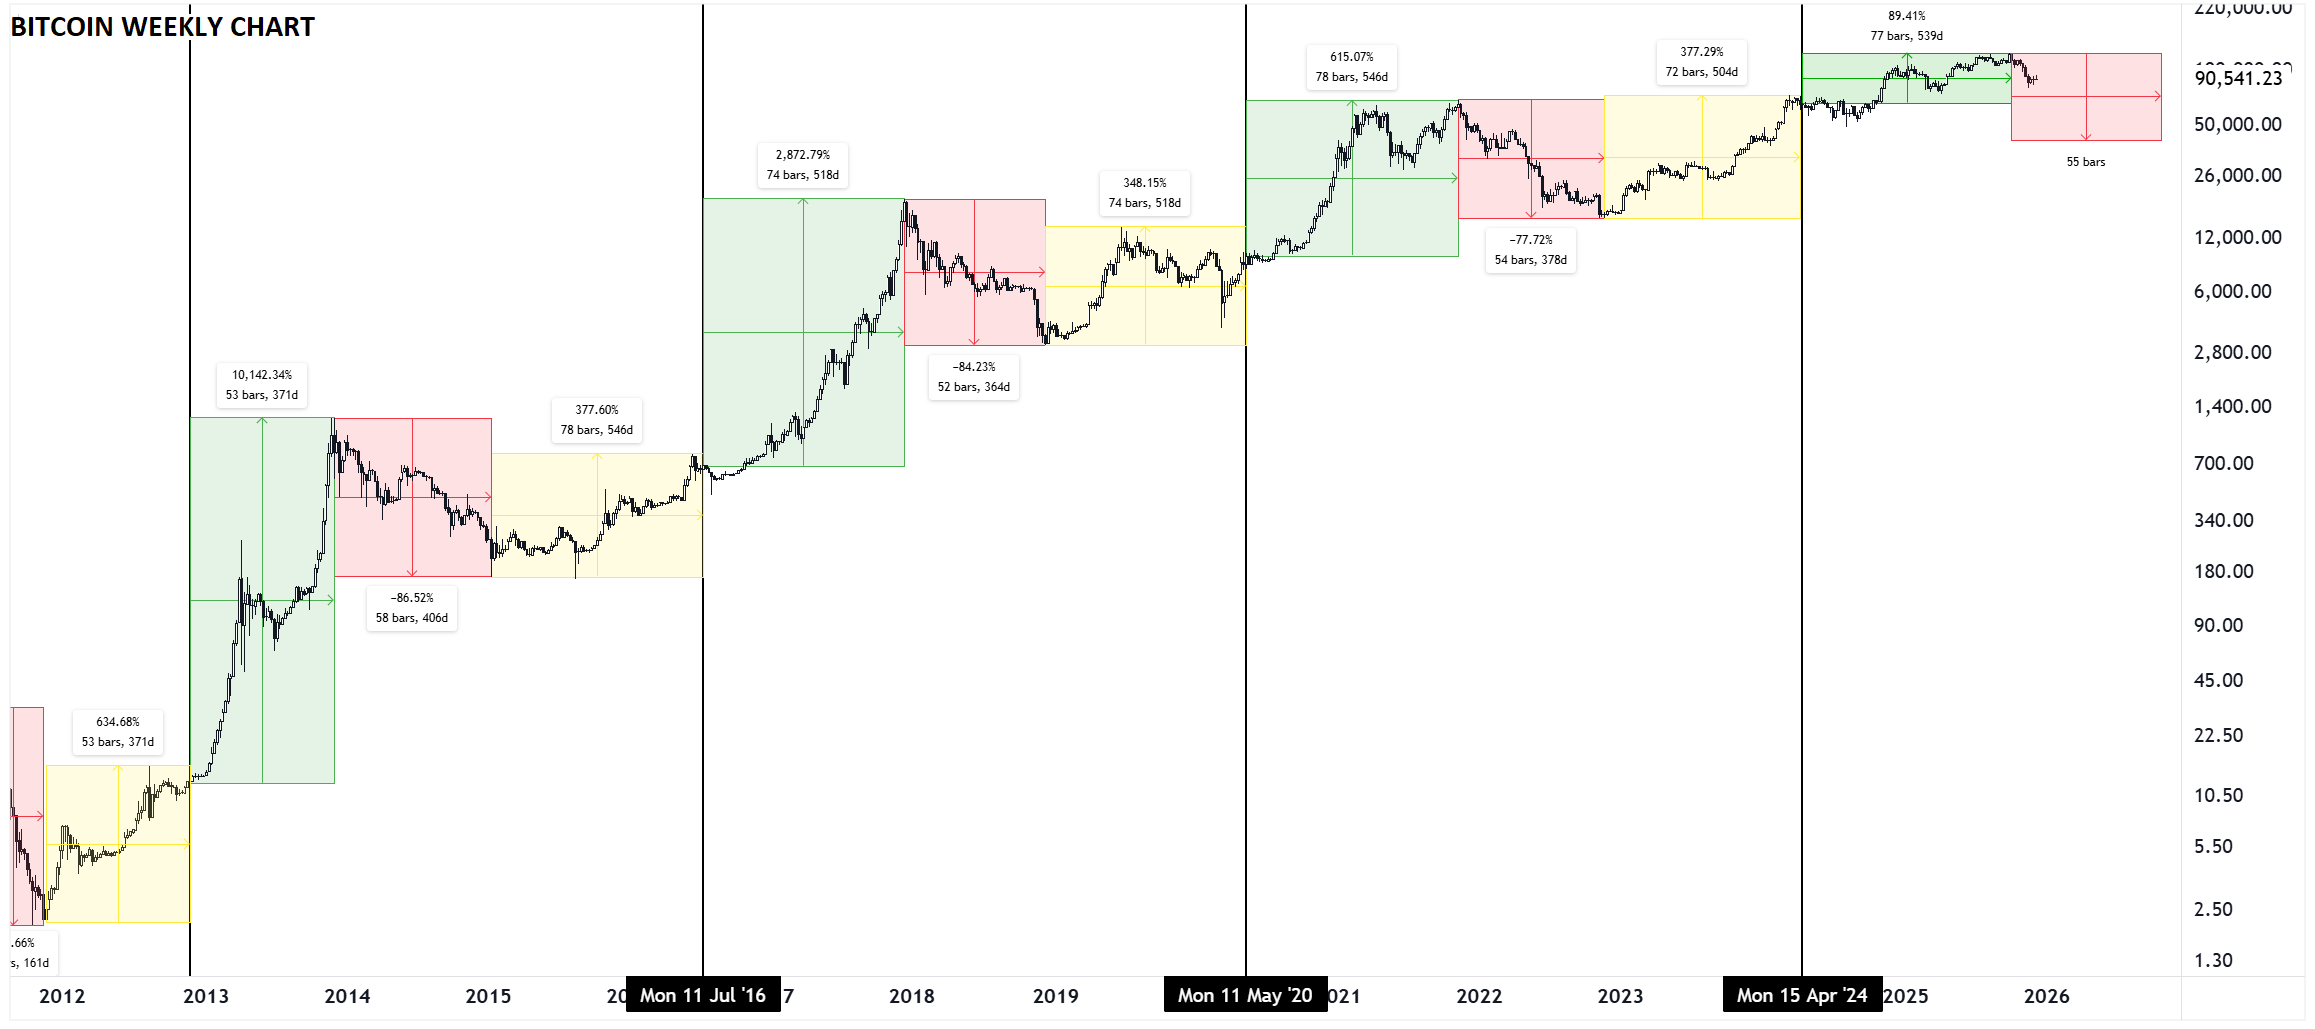
The 2024 halving cut the daily creation of new Bitcoin in half, effectively tightening the supply available for the market. This reduction in issuance is the primary mechanic behind historical price cycles, creating a scarcity pressure that often precedes significant price appreciation in the 12 to 18 months following the event.
Historical data from previous halving cycles shows that the supply shock creates a lag effect. Miners sell less BTC to cover operational costs, while institutional demand, driven by spot ETFs, continues to absorb the available supply. This imbalance forces buyers to compete for a shrinking pool of liquid assets, a dynamic central to most long-term forecasting models.
The Stock-to-Flow model, which measures scarcity by comparing existing supply to new production, suggests that this reduced issuance pushes the asset toward higher valuation tiers. While no model is perfect, the consistent pattern of supply contraction following halving events remains a foundational signal for long-term forecasting.

![Lined bitcoin trading journal notebook for traders (6x9 in) [120 pages] by novabooks: Lined Notebook, Log, Diary & Journal - Writing Trading Journal Idea / Strategies / Trading Plan / Notepad](https://m.media-amazon.com/images/I/71N9POz5DJL._AC_UY654_QL65_.jpg)

As an Amazon Associate, we may earn from qualifying purchases.
Risk Warning: Bitcoin is highly volatile. Price predictions are speculative and based on historical patterns that may not repeat. Never invest more than you can afford to lose.
Institutional adoption via ETFs
Spot Bitcoin ETFs have fundamentally altered the demand landscape for 2026. By allowing traditional financial institutions to hold Bitcoin through regulated vehicles, these products provide a steady inflow mechanism that supports higher price floors. This structural shift reduces the reliance on retail speculation, creating a more stable foundation for the asset.
The competition among major providers highlights the scale of institutional commitment. BlackRock's IBIT and Fidelity's FBTC have consistently led net inflows, signaling strong confidence from large-scale investors. This institutional accumulation acts as a buffer against market volatility, though the underlying asset remains subject to significant price swings.
While ETFs provide stability, the broader market context remains uncertain. Recent analyses suggest a complex probability distribution for 2026, with some models indicating a 35% chance of Bitcoin falling below $40,000 and only a 17% chance of reaching $100,000 by year-end. Investors must weigh the steady institutional support against these stark downside risks.
| ETF Ticker | Provider | Market Status |
|---|---|---|
| IBIT | BlackRock | Leading inflows |
| FBTC | Fidelity | Strong inflows |
| BITB | Bitwise | Active |
Global liquidity and rate cycles
Bitcoin’s trajectory in 2026 is tightly coupled to the Federal Reserve’s interest rate decisions and the broader availability of global liquidity. When central banks lower rates and expand their balance sheets, cheap capital flows into risk assets, often lifting Bitcoin alongside equities. Conversely, tight monetary conditions drain liquidity from speculative markets, creating headwinds for digital assets.
Market sentiment indicators suggest a cautious outlook for 2026. Analysis from Yahoo Finance indicates that Bitcoin has only a 17% chance of reclaiming the $100,000 price level this year. In contrast, there is a 35% probability of the price falling below $40,000, highlighting the significant volatility inherent in these macro conditions [[src-serp-5]]. These probabilities reflect the market’s assessment of how rate cuts or hikes will impact risk appetite.
Investors should monitor Federal Reserve statements and liquidity data closely. The relationship between monetary policy and Bitcoin is not always linear, but historical cycles show that liquidity expansions tend to benefit the asset. However, the risk of a downturn remains high, and positions should be managed with appropriate risk controls.
Key products for monitoring
To track these macro trends and manage exposure, consider using established financial tools and platforms. For instance, CoinTracker offers portfolio tracking that integrates with major exchanges, helping you monitor how your holdings correlate with broader market moves. Alternatively, Ledger hardware wallets provide secure storage for long-term holdings during volatile periods, ensuring your assets remain safe regardless of short-term price fluctuations.
How do interest rates affect Bitcoin? Lower interest rates typically increase liquidity, which can boost Bitcoin prices. Higher rates tend to reduce speculative investment in risk assets like crypto.
Is Bitcoin likely to hit $100,000 in 2026? Current market odds suggest a low probability, with estimates around 17%, while the risk of dropping below $40,000 is higher at 35%.
What should I watch for in 2026? Watch Federal Reserve announcements, US Treasury yield curves, and global money supply data (M2) for signs of liquidity changes.
On-chain metrics and holder behavior
Forecasting Bitcoin’s 2026 trajectory relies heavily on distinguishing between speculative trading and strategic accumulation. On-chain data reveals the true conviction of market participants, often signaling momentum shifts before they appear in spot prices. When long-term holders accumulate while exchanges drain, the supply shock typically precedes significant price appreciation.
Long-term holder supply acts as a stabilizing force. This metric tracks coins that have not moved for extended periods, indicating investors who view Bitcoin as a store of value rather than a trading asset. A rising long-term holder supply suggests strong conviction, reducing the circulating supply available for sale. Conversely, a spike in long-term holder spend output suggests distribution, often marking local tops.
Exchange reserves provide a complementary signal. As coins move off exchanges into cold storage, the liquid supply shrinks, making the asset more sensitive to demand spikes. Monitoring these flows helps separate short-term volatility from structural supply constraints. Keep in mind that Bitcoin remains highly volatile; these metrics indicate probability, not certainty.
Bitcoin Price Prediction 2026 FAQ
How high will Bitcoin go in the next 5 years? Projections vary widely, but a 5% annual growth rate suggests Bitcoin could reach approximately $128,000 by 2041. Polymarket currently assigns a 100% probability to Bitcoin hitting at least $90,000 before 2027, highlighting the market's bullish long-term sentiment.
Is Bitcoin a good investment for 2026? Bitcoin remains a high-volatility asset. While historical data shows strong long-term growth, short-term prices can swing dramatically. Never invest more than you can afford to lose, and consider dollar-cost averaging to smooth out entry points.
What are the main signals for Bitcoin in 2026? Key indicators include the post-halving supply shock, institutional adoption via spot ETFs, and macroeconomic liquidity cycles. These factors collectively drive the long-term price trajectory more than short-term technical patterns.
No comments yet. Be the first to share your thoughts!